
If you’re a recent graduate or a working professional looking to transition into data space and have questions such as
1. What skills do I need to learn?
2. How do I learn Programming?
3. What strategies should I follow to find a job?
4. How to stand out in such intense competition?
5. Will those without relevant background face difficulties?
Then check out the latest FREE episode of the podcast “The Starlight Podium”, where we dive into the above questions + many more to help guide your path into this exciting field.
Introduction
Coming back to today's topic, the capability to selectively show/hide elements within Power BI can elevate the storytelling component of a report to the next level. By introducing interactivity through slicer selections, dashboards can provide users with deeper insights and a more tailored data exploration experience. This capability not only makes reports more engaging but also allows for a more focused analysis, where users can drill down into the specifics without being overwhelmed by unnecessary information. Let's say we want to achieve the following
Example: age group cartoons appear on the user selection
There are several ways to achieve this, each with its respective pros/cons. Bookmarks are the first ones that come to mind. They are versatile to the point where you have limited combinations of 'selection' options. Once it passes that threshold, maintaining it is a hassle. Additionally, you also need the end-user to click different buttons for your bookmarks to work.
The more robust solution is to use DAX measures to tackle the problem. We will look at some of the approaches in this post and understand the use cases.
Table of Content
- The need for conditional visual display
- Implementing show/hide logic using DAX
- Testing and Troubleshooting
- Advanced Tips and Tricks
- Conclusion
The Need for Conditional Visual Display
The primary use case of Slicers in Power BI is to act as an interactive filter placed directly on the report canvas, offering a straightforward way for users to select and view specific subsets of data. Our use case is slightly advanced where we want to use the slicer to not only slice and dice the data but also utilise it to show/hide visuals on the report.
Conditional visual display addresses the need for reports to adapt to user interactions, providing a more personalized analysis experience. For example, in a sales dashboard, visuals showing detailed regional sales data can be configured to only appear when a specific region is selected through a slicer. This approach reduces clutter and focuses the user’s attention on relevant data, making the dashboard more efficient and easier to use. Such dynamic behaviour enriches the user experience by displaying only the most pertinent information based on their selection.
Implementing Show/Hide Logic with DAX
The process involves creating a measure that evaluates to true or false depending on the slicer’s selection. This measure can then be used to control the transparency of visuals in the report.
If you are new to Power BI and this is the first time you are hearing transparency, then let me provide a short refresher.
Hexadecimal Numbers in Power BI for Color Specification
Hexadecimal (hex) numbers are a base-16 numeral system. This system uses sixteen distinct symbols, 0-9 to represent values zero to nine, and A-F (or lowercase a-f) to represent values ten to fifteen. In Power BI, hexadecimal numbers are commonly used to specify colours. This usage aligns with web development and digital design practices, where colours are often defined using hex codes. A hex colour code starts with a hash sign (#), followed by six hex digits. These six digits represent the intensity of the red, green, and blue (RGB) components of the colour, respectively. The first two digits represent the red component, the middle two represent the green component, and the last two represent the blue component.
For example, #FF0000 represents the color red. Here, FF (the maximum value for two hex digits) indicates the full intensity of the red component, and 00 for both green and blue components means they contribute nothing to the colour, resulting in pure red.
In addition to specifying colours through hexadecimal codes, Power BI and many design-related applications offer the ability to control transparency or opacity levels. This is often achieved by adding an extra pair of hex digits to the standard six-digit hex colour code, leading to what is sometimes referred to as an eight-digit hex code or RGBA format.
In the eight-digit format, the first six digits continue to represent the colour (red, green, and blue components), while the last two digits specify the transparency level of the colour. These transparency values range from 00 (completely transparent) to FF (completely opaque). For example, #FF000080 would represent a semi-transparent red, with FF0000 defining the red colour and 80 (about 50% of FF) indicating the transparency level.
Overview of Solution
Now, the key to this solution is the expression-based formatting of colours using DAX. The trick then lies in having something that can switch its colour between a pre-defined colour and being transparent.
- Use anything like shape visual, card visual etc that allows conditional formatting to mask certain areas of the canvas.
- Write a DAX measure to check if there is a filter applied and use that to render the visual blank i.e. change the colour or “transparency” based on the slicer selection.
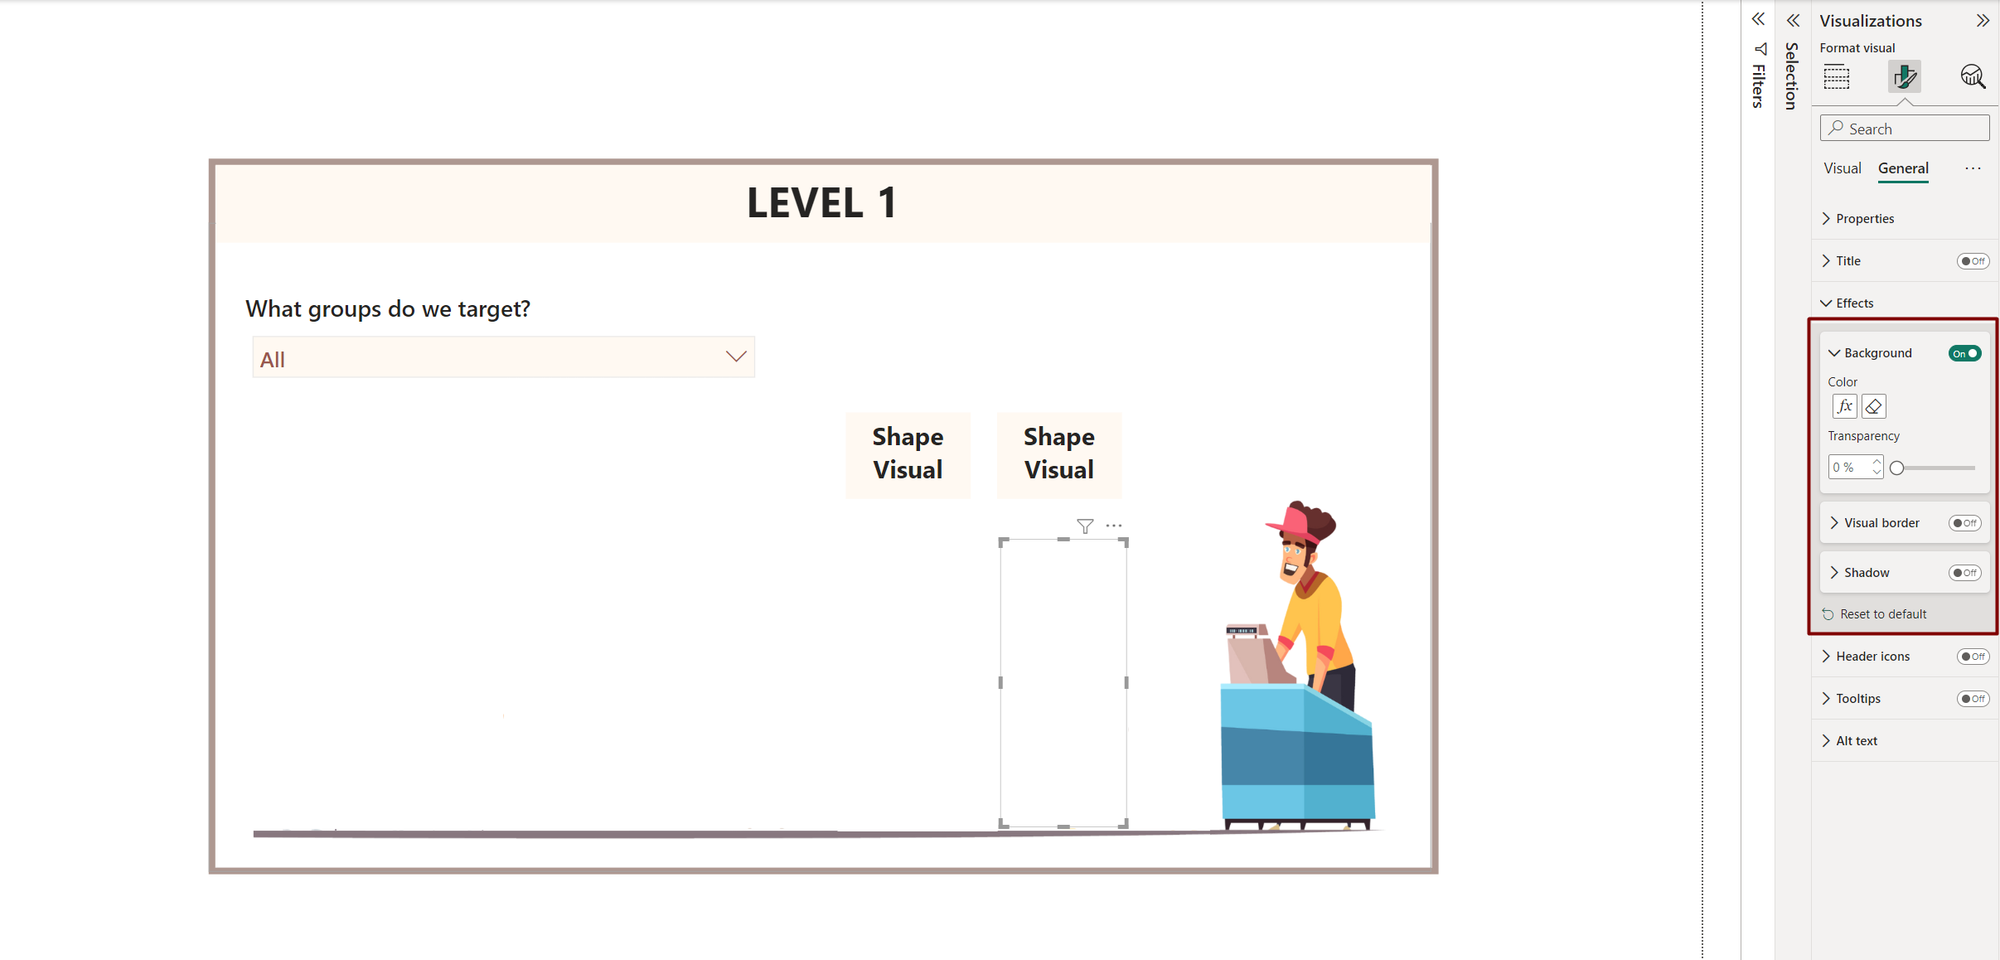
Level 1 of implementing the solution
We’ll start with a simple measure using ISFILTERED() that will return TRUE whenever any selection is made in the slicer. In our example, we will apply the transparency filter on a shape visual based on the slicer selection. The following DAX measure is applied to the background colour option of a shape visual. The same can be achieved using card visuals as well.

Look at the following video to understand the impact of this measure. As you can see, this only works when 'any' selection is made in the slicer without any logic.
Example: age group cartoons appear on the user selection
This kind of measure can be useful when you want to show/hide some chart or text box that doesn't need any specific logic to be checked.
Level 2 of implementing the solution
Next, we’ll try another simple measure called SELECTEDVALUE() that will return TRUE whenever the specified logic is satisfied by the slicer selection. The following DAX measure is applied to the background colour option.
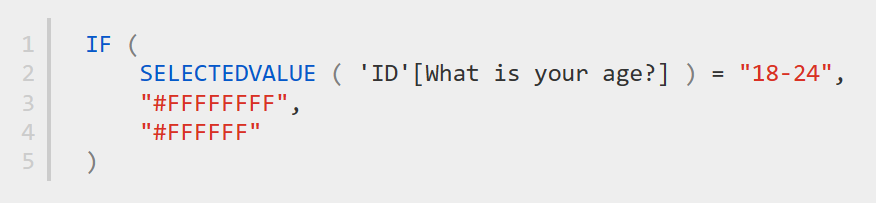
Note: We have another measure for the age group of "25-34" as well.
Look at the following video to understand the impact of this measure. As you can see, this only works when a 'particular' selection is made in the slicer. Also, this stops working whenever multiple selections are made.
Example: age group cartoons appear on the user selection
This can be a simple solution when you are using the 'single-select' type of slicer to show/hide something. However, in a scenario where it is necessary to have a specific combination of values from the one slicer selected before the visual can be revealed, ISFILTERED() is too broad and SELECTEDVALUE() is too narrow. But this is an improvement over the last one since now we can take into consideration individual conditions.

Level 3 of implementing the solution
In this attempt, we need to take advantage of CONCATENATEX() returning the selected values as a text string, and then test that string for a specific combination using CONTAINSSTRING() function. There can be other approaches to solve this as well. However, this is what I came up with for my use case. Try and see if you can come up with a different variant.
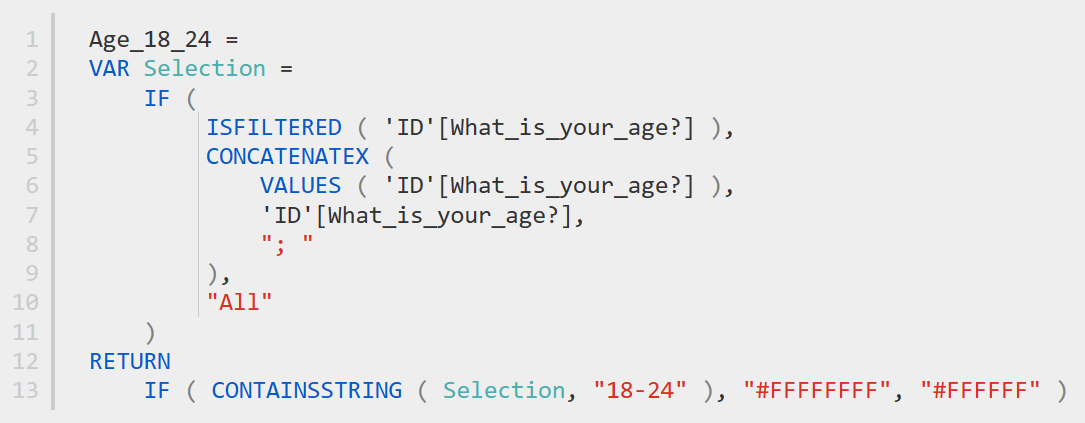
Note: We have separate measures for all the different age groups.
Look at the following video to understand the impact of this measure. As you can see, this measure can tackle any combination of values from the slicer to show/hide a visual.
Example: age group cartoons appear on the user selection
Testing and Troubleshooting
Rigorous testing is crucial to ensure that the dynamic visuals in your Power BI report function as intended. This testing should involve trying various slicer selections to verify that visuals show or hide appropriately. Additionally, it's important to be prepared for common issues that may arise, such as visuals not responding as expected due to misconfigured DAX measures or filters.
Advanced Tips and Tricks
To maintain optimal performance of your Power BI report while using dynamic visuals, consider implementing best practices for DAX measures and visual configuration. Let's look at a few more use cases.
Show/Hide visuals directly
We’ll use a simple measure using the familiar SELECTEDVALUE() to show/hide any visual not just limited to shape/card visuals. We need to drag and drop the measure into the filter menu on the right and voila!! you can now see the impact of the measure below.

Use the new SLICER visual
We can also use the new slicer visual in combination with what we have seen thus far to achieve even more impactful storytelling use cases. We have overlayed the slicer on the existing visual. The slicer similar to before operated on the age selections and we have used 'transparency' to hide the slicer outlines. You can see the following for impact.
Conclusion
This guide provides a foundation to embark on a journey of finding new ways of storytelling in your reports. As you become more proficient, explore advanced features and customization options to make your report more powerful.
You can check some of my previous posts on XMLA endpoints, REST API, PowerShell cmdlets, Power BI Template Files and Power BI for Business Users.

THANK YOU FOR READING !!
Contact me: