We live in a time where the business leaders and end users of a report need to make quick decisions, based on data rather than gut feelings. As important as it is to have a well-designed report, equally important is the accessibility and adoption of the report across the organization.
Today, I'm going to explain how you, a business user can navigate Power BI and make the best use of it. This journey is crucial as learning how to effectively use Power BI can revolutionize the way you interact with data, offering insights and efficiencies previously out of reach.
Are you excited to make the most out of Power BI for your business needs?
Table of Content
- How to access Power BI content?
- How to interact with a Power BI report?
- How to use the action bar to maximize your decision-making capabilities
- Ask your team to add this page to your organization!!
How to access Power BI content?
Accessing the Power BI Service
You might come across the term "Power BI Desktop". This standalone tool is where the magic of creating reports happens, but as a business user, your domain is primarily the Power BI service.
To access the Power BI service:
- Simply enter the address app.powerbi.com in your favourite browser
- Enter your work email <name>@<organization>.com
- If your organization uses some authenticator app, then Clicking Next will take you to that login page. You can authorize your login and proceed ahead

Remember, the layout and content of the Home page are tailored to you, evolving as you engage more with the platform.
Let's touch base on some housekeeping items. Since your BI team creates the reports and shares them with you, one of two scenarios will apply to you:
- Your organization has a Power BI Premium subscription, and the content that's shared with you comes from Premium Capacity. You can identify this by the diamond icon 💎 beside a workspace name. (We will discuss what's a workspace later!)
Workspaces option. This just means that your email has not been added by the Admin.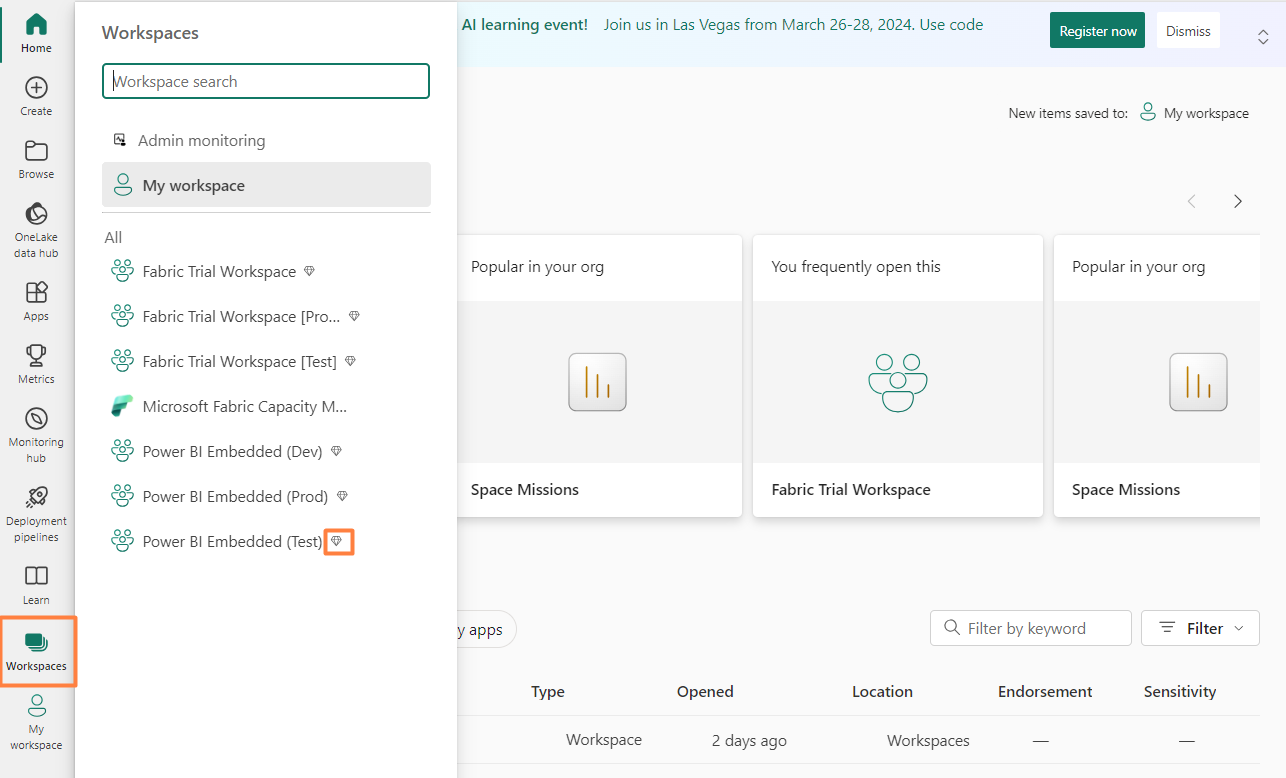
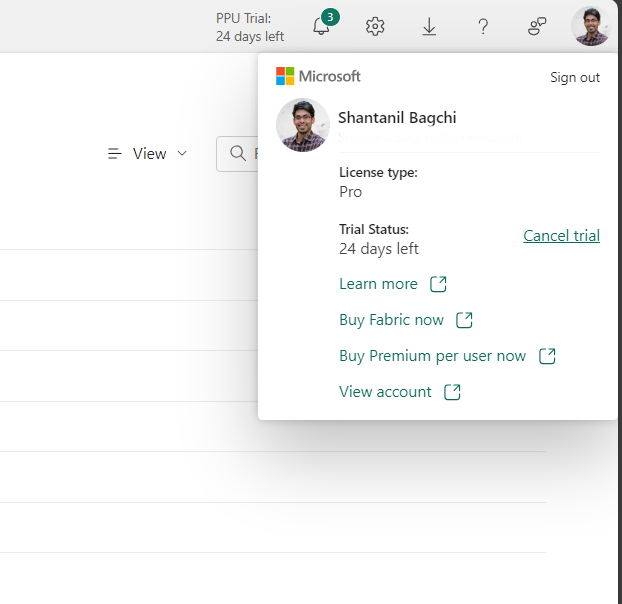
- If your organization isn't using a premium capacity, then you, as an individual user must have a Power BI Pro license or Premium Per User (PPU) license. You can check out your license by clicking your name. As you can see, my name has
Promentioned in the license type.
Now that we are done with a little recap, let's dive down.
How to access Power BI content?
Getting around in Power BI service
A common mistake is not exploring the full range of what Power BI offers. To avoid getting stuck, take the time to familiarize yourself with the navigation pane, the different types of content available to you, and how to access them. This exploration will significantly enhance your ability to find and utilize relevant data quickly.
After you sign in to the Power BI service, you will land on Home by default. The layout and content of Home is different for every user. The Home canvas is your gateway to a world of data- it shows your favourite, frequent, recent, and recommended apps and workspaces. New users have less content, which changes as you use Power BI more often.

Apps
An app is a Power BI content type that combines related dashboards and reports, all in one place. An app can have one or more reports and dashboards, all bundled together. These are created by Power BI designers/developers who distribute and share the apps with business users like you.
One way to access your apps is to select Apps from the nav pane and choose an app to open. If you don’t find any, then click on the ‘Get Apps’ option to find apps circulated in your organization.

Workspaces
A workspace is also used to publish reports and dashboards with the exception that semantic models (previously data models), dataflows and more reside here. Generally, you wouldn't need to access a workspace as a business user; an app is the preferred route.
If someone in your organization adds you to a workspace, it appears in your list of workspaces. Over time, you might have more than one workspace. A workspace opens on your canvas, and the name of the workspace is listed on your nav pane.

Both Workspace and Apps allow you to access Power BI content like reports (which is going to be our main focus). The look, feel and available user options are nearly the same no matter where you open it from. Generally, report designers/admins will choose Apps as the preferred way of sharing content with business users like you.
Finally, understanding this distinction between Apps and Workspaces and how they can serve your data analysis needs is vital for your Power BI exploration journey.
How to interact with a Power BI Report?
A Power BI report is a multi-perspective view of a data model, with visuals that represent different findings and insights from that model.
A report can have a single visual or pages full of visuals. Reports are created by Power BI designers/developers who distribute and share the reports with business users like you. Following is a sample report layout when opened in a workspace.

Various visual elements on a report page have different names. You may hear these terms when speaking with the BI team or may need to refer to them to point out something specific.

Cross-Filtering and Cross-Highlighting Visuals
By default, selecting a data point in one visual on a report page will cross-filter or cross-highlight the other visuals. Actions like this are useful to identify how one value in your data contributes to another.
The report designer sets how the visuals on a page interact. Designers can turn visual interactions on and off and change the default behaviour.
Demo of Cross filtering, Cross highlighting and Slicer Interaction
As you can see above:
• Cross-filtering removes data that doesn't apply. Selecting County in the bar chart cross-filters the line chart. The line chart now only displays data points for the selected county.
• Cross-highlighting retains all the original data points but dims the portion that doesn't apply to your selection. Selecting a County in the bar chart cross-highlights the column chart at the bottom.
Using Page-Level Slicer/Filter Visuals
Another key step is mastering slicers and filters, which allow you to refine what you see to make more informed decisions.
A slicer is a type of visual that filters the other visuals on a report page. These are similar to the previous type of interaction, however, these are not transient i.e. once you select an option from a filter they will be applied across the page as long you don't change them. Compared to the cross-filtering behaviour, once you click on something else on the report, that behaviour is lost and is transient.
When using Power BI reports, you'll discover many types of slicers. Some of the commonly used ones are:

- In a vertical checkbox slicer and hierarchy slicer, you can select one or more checkboxes to see the impact on the other visuals on the page.
- Additionally, in a hierarchy slicer, you use the chevrons (^) and (v) to expand and collapse the hierarchy.
- Sometimes, the report designer will set the slicer to only allow you to select one value at a time as shown in the rightmost vertical slicer.
- In the case of a tile slicer, you can either select single options or use CTRL+ Select to choose multiple options.
- Finally, with a relative time slicer, you can apply time-based filters to any date or time data in your report.
You may have seen in the above video how a slicer can filter other visuals.
Using Buttons in a Report
Report designers add buttons on reports to help you easily navigate and explore. Here are some button types: back, bookmark, arrow, help, etc. Generally, if a designer has done a good job, then you would be able to see a pop-up text when hovering over a button to provide more context.
- Page navigation buttons take you to a different page in the same report. Report designers often create these to tell a story or guide you through the report insights. Below, Overview and Product Analysis are Page navigation buttons.
- Report designers often include bookmarks with their reports to take you to a particular view of the report. Here, the Reset Filter button uses a bookmark to remove any filters that you have applied.

- Similarly, designers can use a back button that may/may not have an arrow icon. When you click it, you will be taken to the previous page.
- Other times, there can be a help button too to help direct you/ aid you in the analysis journey like the More button in the picture.

Demo of report navigation using buttons
Header Options in a Report Visual
There are additional options that can pop up as header icons when you hover/select a particular visual. These additional options can assist you in your analysis. However, the report designer sets whether you get to see these additional icons. The designer can turn this on/off for selected visuals.

Look at the following video to understand more:
Demo of various header options for visuals
You can read the official Microsoft doc at Drill mode - Power BI | Microsoft Learn to understand even more.
You can play around with one of my reports below. You will see some of the options mentioned above are missing. I have set some of these options 'off' as per report requirements.
How to use the Action Bar to maximize Power BI capabilities?
File Menu
There are multiple options provided when you click the file menu as described below. The most common ones that you will use most often are Save a copy and Download this file.

Export Menu
Export provides you with the capability to either play around with the underlying data in Excel and/or add the whole report or any selected visual in a PowerPoint presentation. All of these options aid you in sharing your findings with your colleagues easily.

Explore data & Get Insights
Similar to how Analyze in Excel works, Explore this data helps you to play around with the underlying data on the go in Power BI Service. The type of visualization is adjusted automatically to aid you in decision-making.
The other feature ‘Get Insights’ is also quite useful for finding quick insights into your data.

Options on the right of the Action Menu
Some other handy options are shown in the image below. These can range from assisting you to save a particular snapshot of the data and adding comments to inform your colleagues to tasks like adding the report to your favourites or resetting your applied filters.

Ask your team to add this page to your organization!!
If you found value in reading this post and want other users in your organization to quickly learn how to use Power BI using this post, you can ask your BI team to implement the following steps. This will help anyone quickly access the site without the need to bookmark this page in your browser.
- Go the
Update Appsettings for a workspace and then click on the drop-down icon beside theAdd Contentoption. This will provide you with the option toAdd a link.
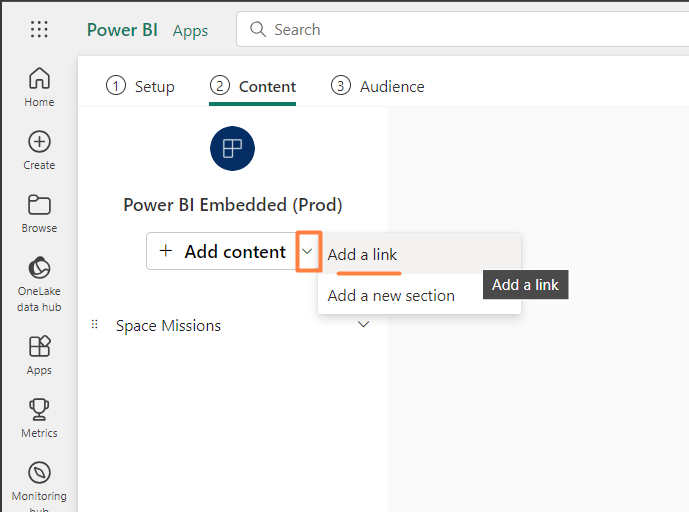
- Enter
📝 User Manualor any other name in the Link name. In the Link, addwww.neil-bagchi.com/power-bi-for-business-users/and selectNew taboption.
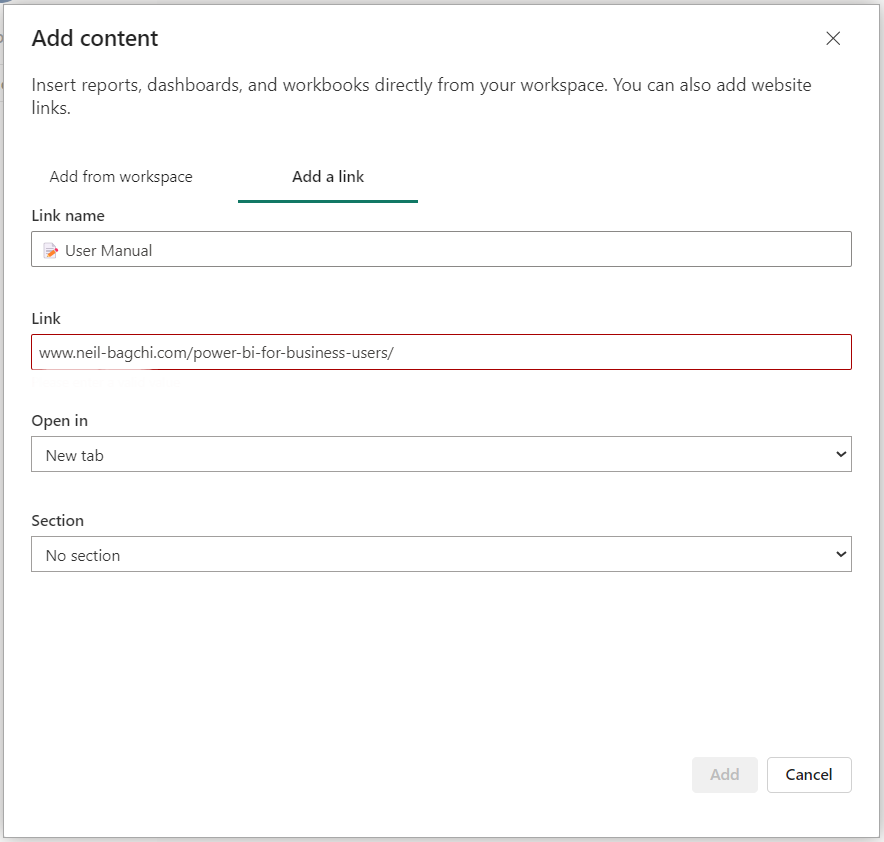
- Click on
Addand that's it. Anyone in your organization can now reference this post whenever they want to learn or revise the various options.
Conclusion
By following these steps and exploring each aspect of Power BI's capabilities, you'll not only overcome the common hurdles many business users face but also unlock new levels of data analysis and decision-making power within your organization. Power BI is a tool designed to bring data to life, and with these strategies, you're well on your way to becoming proficient in extracting valuable insights that drive business success.

You can check some of my previous posts on XMLA endpoints, REST API, PowerShell cmdlets and Power BI Template Files.