On your journey to becoming a Power BI rockstar, you have come a long way and learned about XMLA endpoints, REST API, PowerShell cmdlets and how to use them. This time, we will learn how to create reusable assets and utilize them to manage your enterprise environment. Understanding the nuances will open up a whole new world that is going to expand your capabilities.
Table of Content
- Power BI Template File (PBIT)
- Power BI data Source File (PBIDS)
- Internal working of PBIX and PBIT files
- Downloads
I know a lot of you are technical readers and will easily follow the technical content of the blog post. However, to make this beginner-friendly, I am going to draw parallel narratives to a chef and their kitchen to easily remember the crux of this post.
Think of yourself as a master chef who wants to create a signature dish that can be replicated across the franchises. You need to devise a way to help others recreate your signature dish easily. There's an easy solution...just create a recipe card mentioning the ingredients and detailed steps of the cooking process. Right?
Similarly, you are the rockstar Power BI developer who is tired of reproducing the same visual standards over and over again across organizational reports. You want an easy way for other newbies to replicate the same look and feel across the various reports they are building. This is where our first reusable asset, Power BI template (.pbit) files come into the picture.
A Chef's Recipe Card: Power BI Template (.pbit) File
In the culinary world, a chef's success begins with a well-crafted recipe card. Similarly, your journey in data visualization and report creation starts with a Power BI template (.pbit) file. This template is the blueprint that outlines the structure of the report without containing any data. Note the last words...there's no underlying data in a template file making them an excellent sharing and storing medium, thus preventing data leakage and unauthorized access. So you can easily share this with third parties outside your organization. Isn't that neat!!
A Power BI template file is devoid of data but rich in structure. It includes:
- Schema, relationships, measures, and other data model definition
- Queries, query parameters, and other query elements
- Report pages and visuals
However, like a recipe waiting for its ingredients, it holds placeholders for data, allowing for flexibility and creativity in sourcing data.
What does this mean for you?
Utilizing template files can significantly streamline work processes across your organization by offering:
- A consistent corporate colour scheme and branding on report pages
- Connections to commonly used data sources and parameterized queries for flexible data sourcing
- Predefined DAX measures within the dataset
- Sample visuals adhering to data visualization and accessibility best practices
But where do you find those report templates? Do you create your own or copy it from an existing Power BI report? Can you find pre-designed templates online?
Hold your horses...I know you're excited so let's get into the details individually. Before we go ahead remember the following.
If you search online, you will find very few sites that provide template files directly but there's a plethora of stunning reports available online that you can use to jumpstart.
How to create a Power BI template?
So, let's first understand the process of creating a template file. You can then use the same steps to make a template out of the available online reports too.
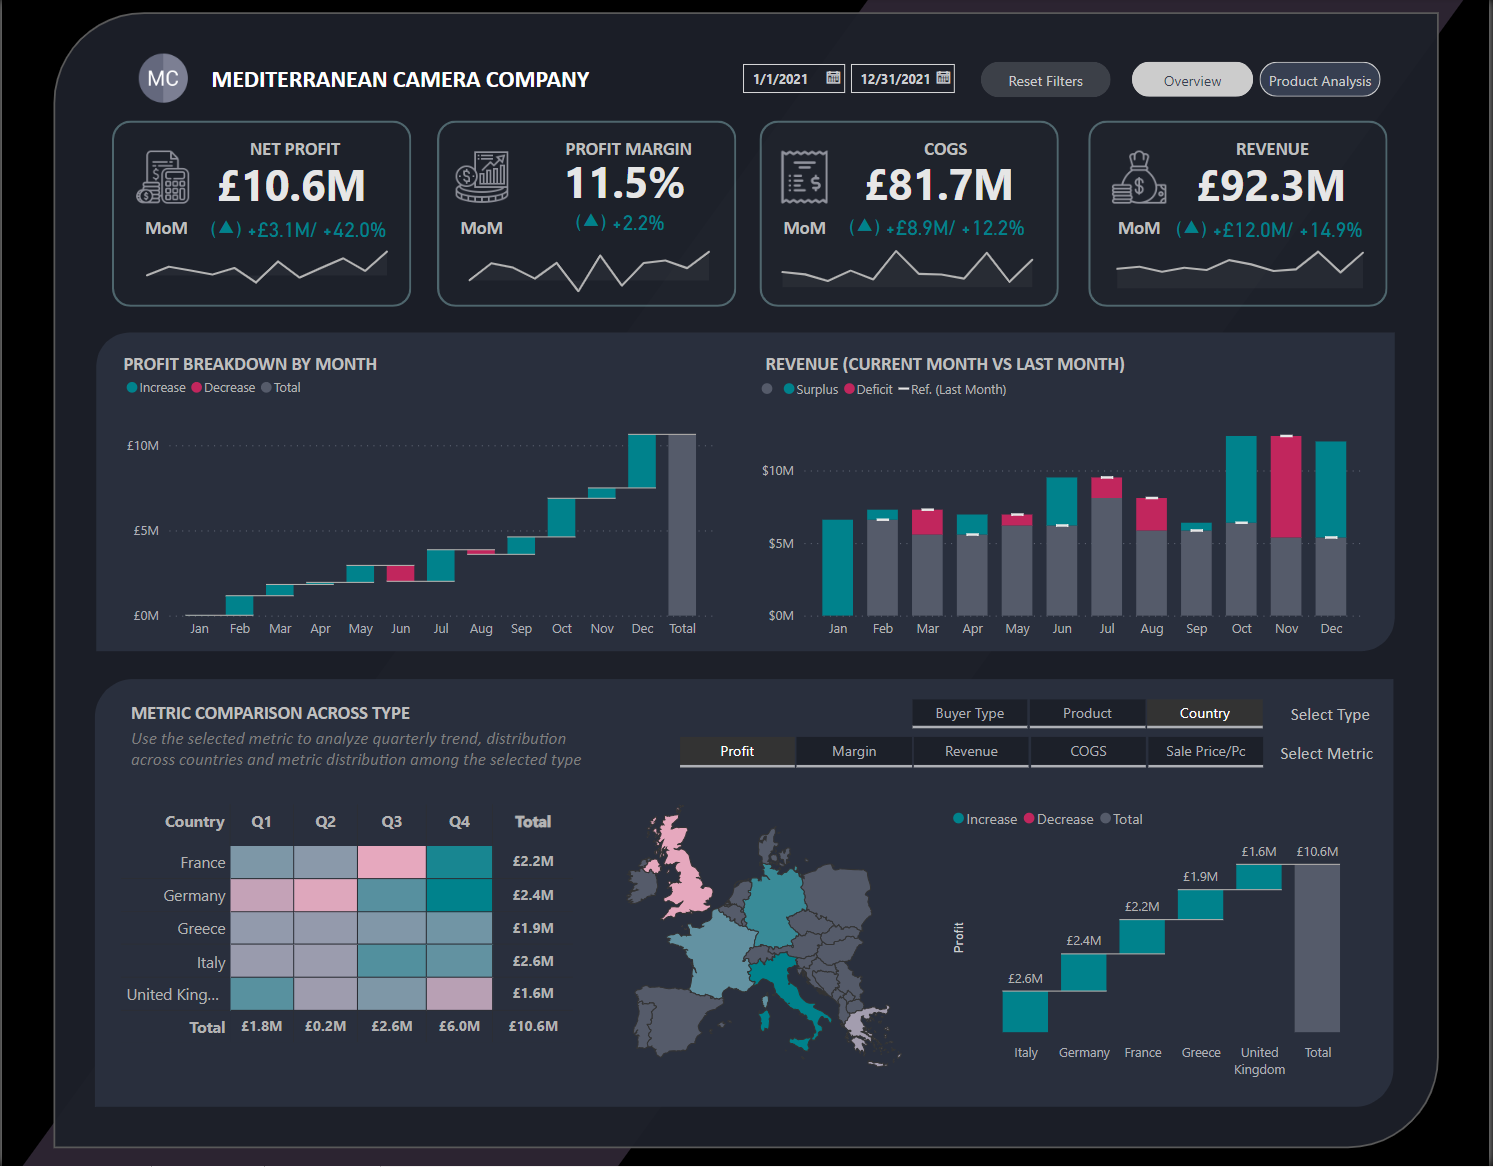
Let's take my report as an example and assume that you like the layout of this report. You want to have a similar layout on all your reports as well.
Creating a template is straightforward:
- Open the report you wish to convert into a template and navigate to 'File' > 'Export'.
- Describe the template and save it with a .pbit extension.
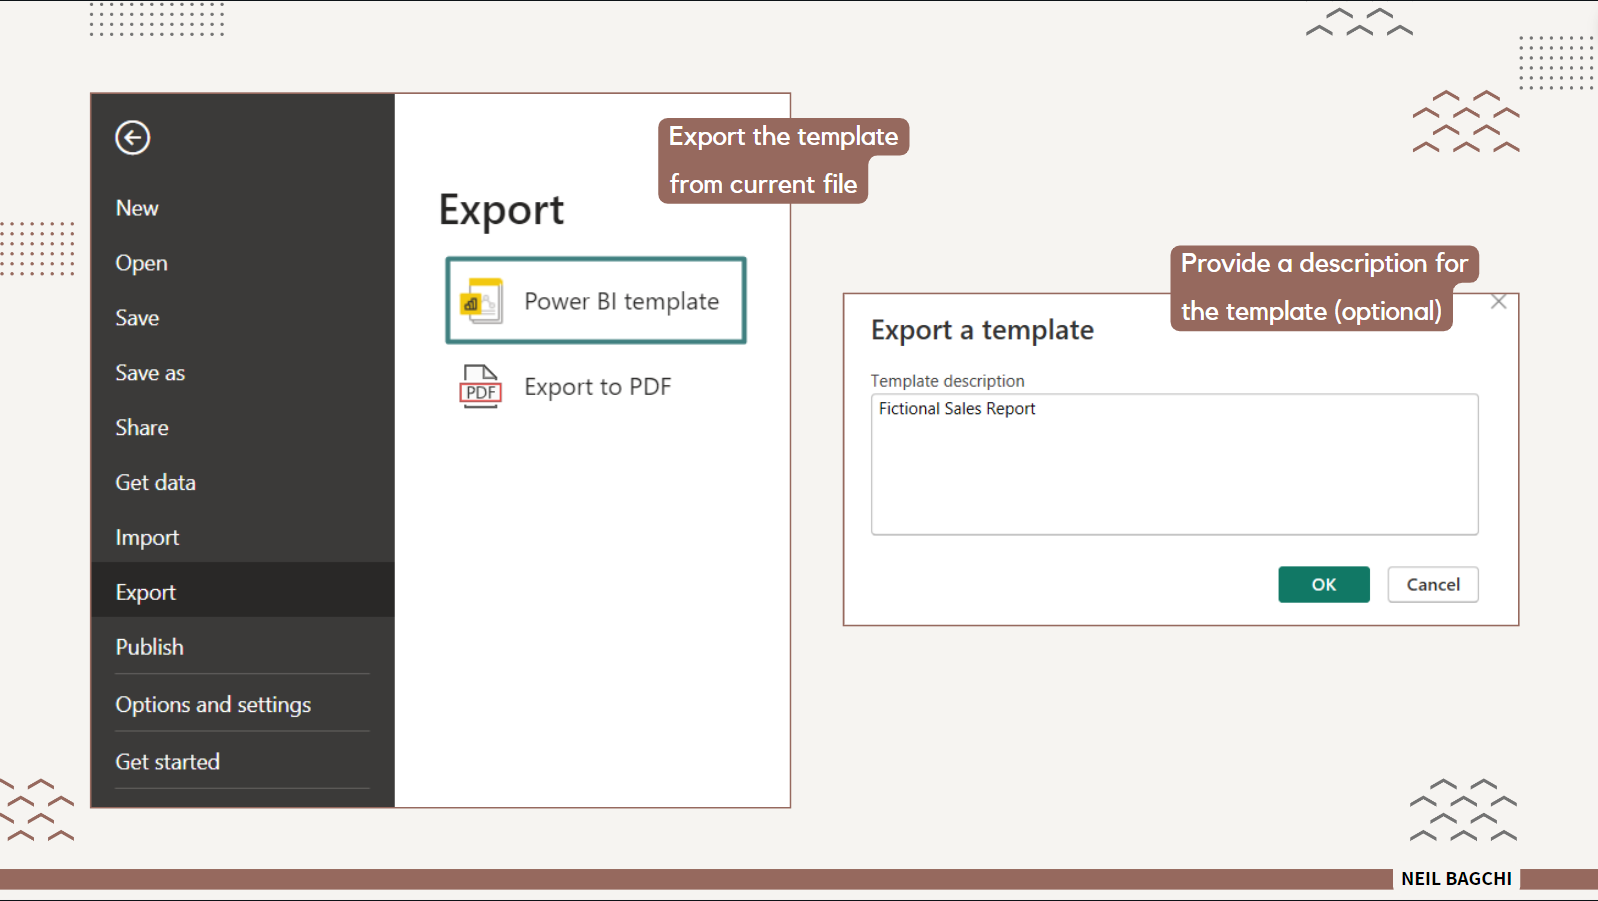
PBIXfileNotice the PBIT extension of the saved file. Congratulations! You've crafted your first template file !!
How to use a PBIT file?
Now that you have your template ready, you can bring this template into a new project
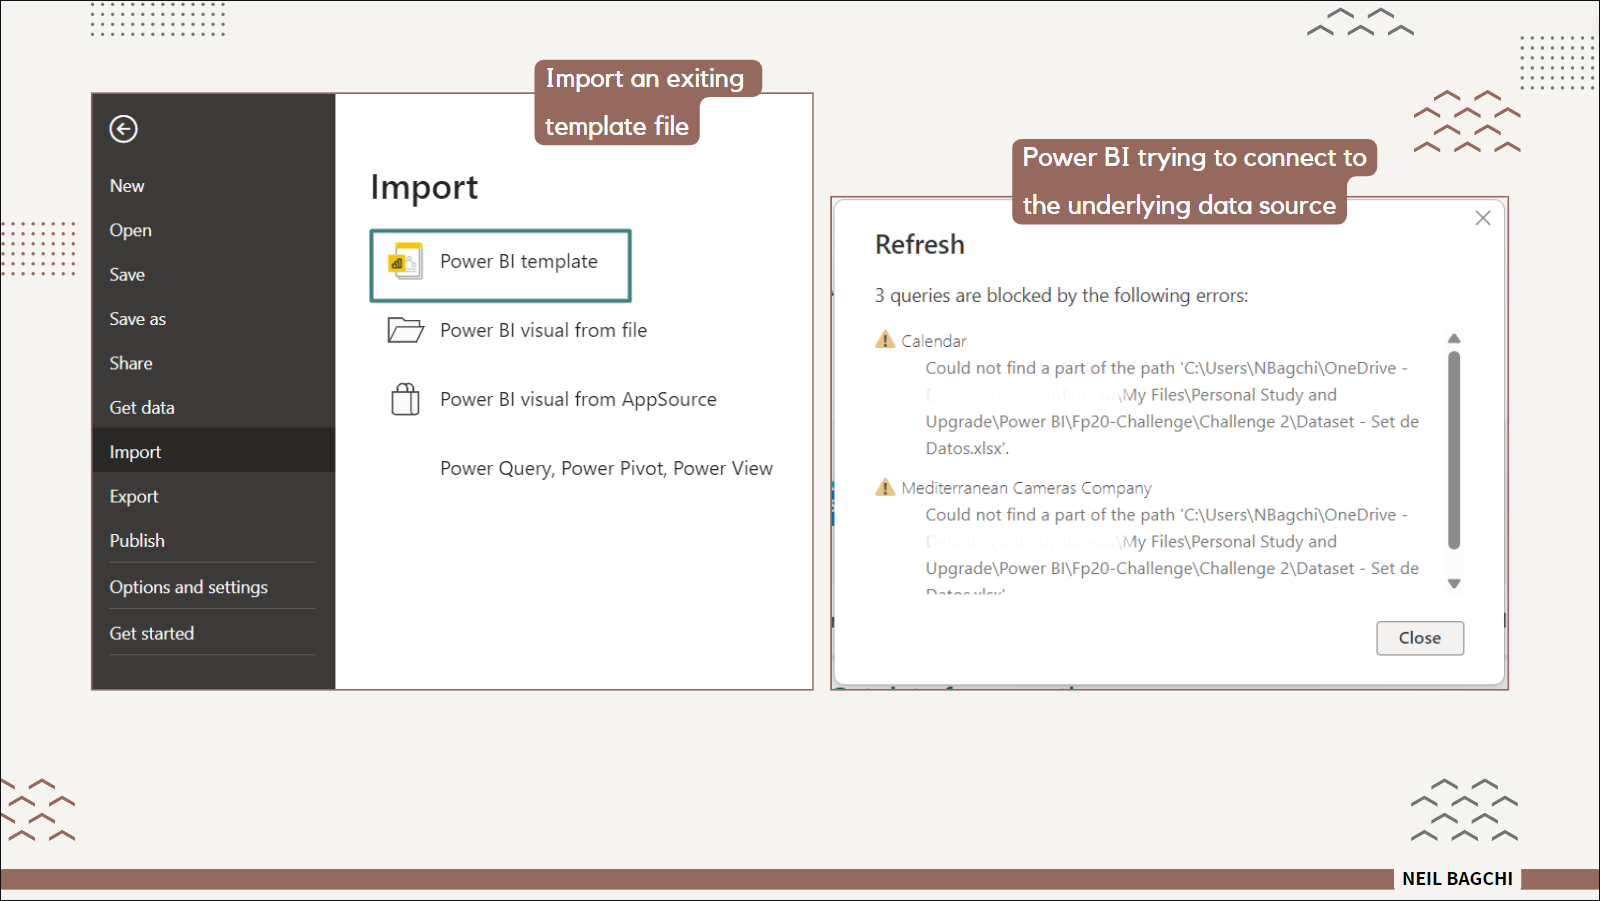
- Go to 'File' > 'Import' and select your .pbit file.
- Upon import, you might encounter warnings about blocked queries due to missing data sources—fear not, this is expected. Since the report is trying to establish a connection with the existing data sources and is unable to find them, it's giving a warning that Power BI is unable to refresh these sources.
- Close the warning window and proceed, as our goal was just to get the report layout, not the underlying data.
PBIT template fileWithout the data, this is how the report looks!! Ouch. 🥲
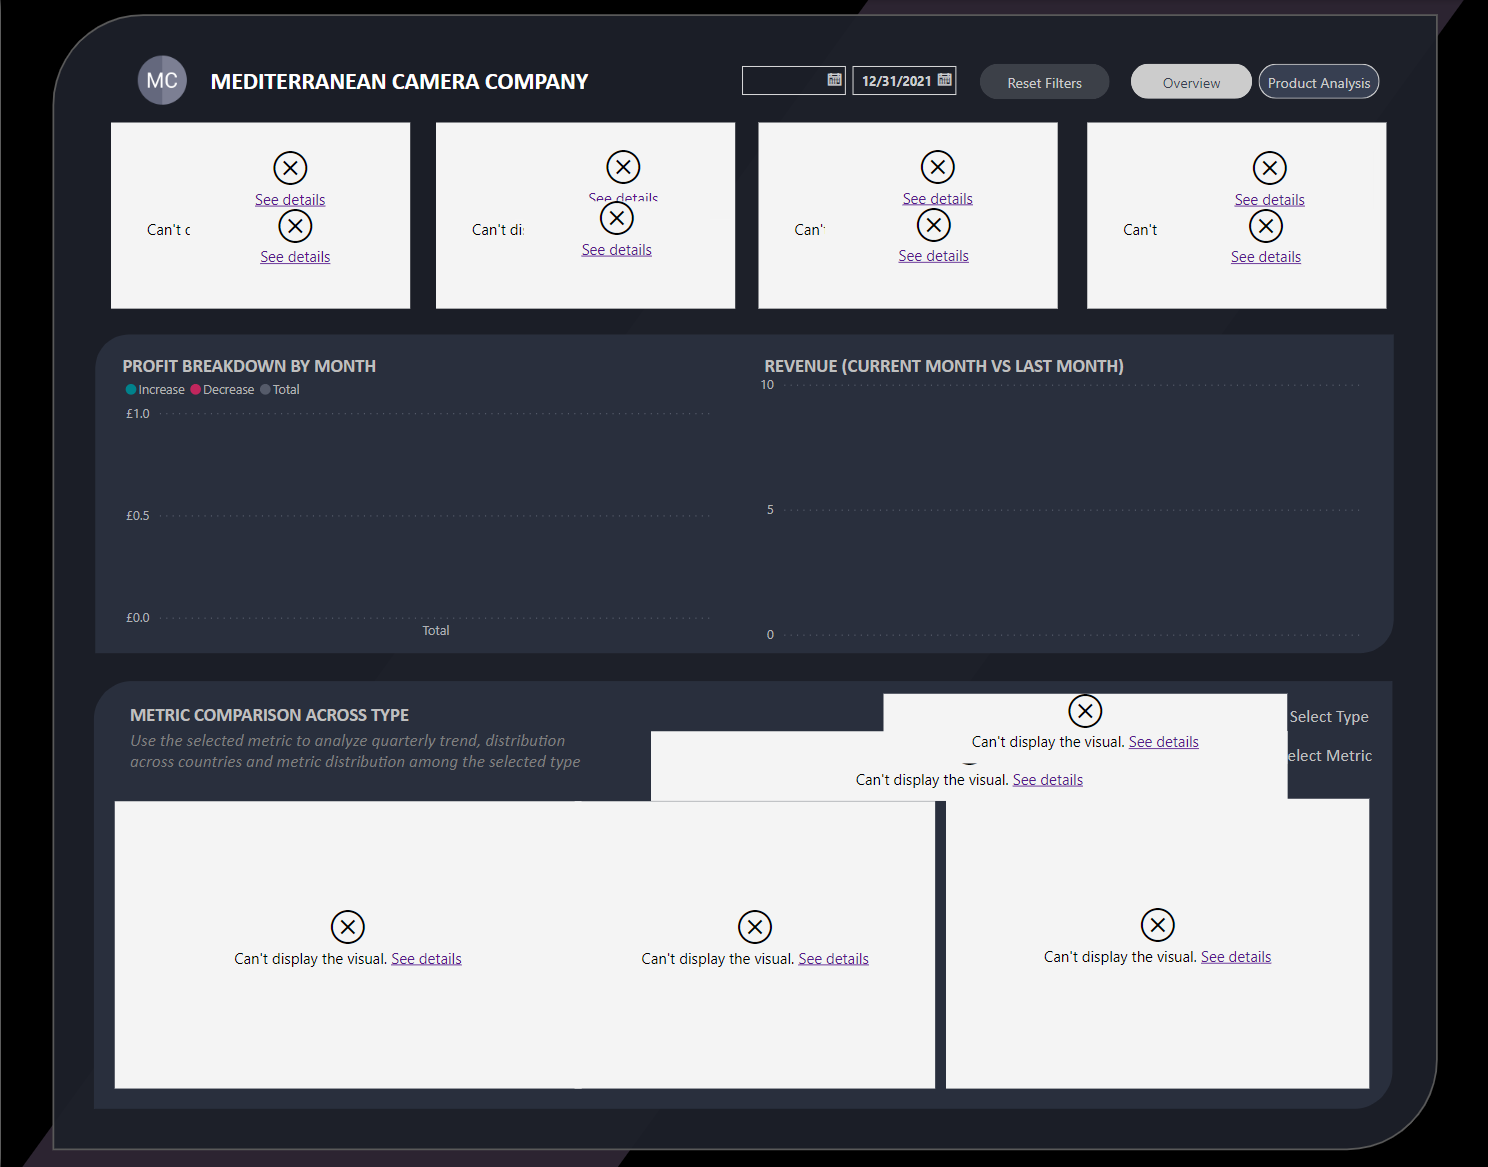
Note that once you specify your data sources, these visuals will come to life and in any case, you can use the format painter option to copy the style for your new visuals too!! Phew 😅
How can I get template files online?
As I mentioned earlier, you won't find a lot of these directly online but there's a workaround. You need to have access to downloadable Power BI files. Power BI gallery is a good starting point. There are other sites as well like Enterprise DNA, Power BI.tips etc.
Let's say you come across a report where the author shared their PBIX file as an attachment as shown below. You can simply create a template file by following the steps outlined before and have it ready for use!! No need to spend long hours formatting your reports to get that look. 😉
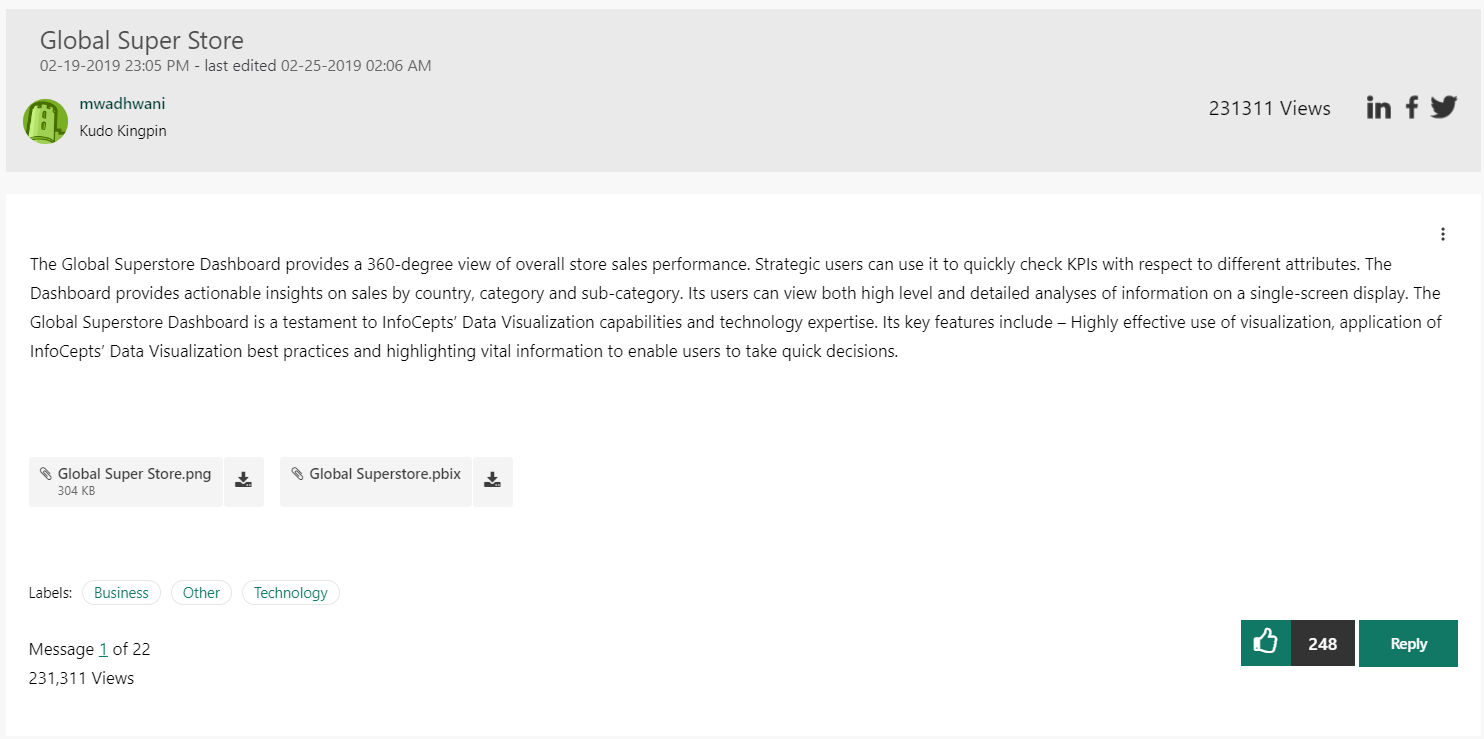
PBIX file attached!! That's your jackpotCurating the Ingredients: Power BI Data Source (.pbids) Files
Just like meticulously selecting the perfect ingredients is crucial for preparing a delightful dish, the Power BI data source (.pbids) file is a configuration file used by Power BI to store connection information for a specific data source except for the user credentials. This is similar to preparing your kitchen with all the necessary ingredients before cooking.
Upon opening a .pbids file in Power BI Desktop, the user is prompted to enter their credentials. This step is vital for authenticating and connecting to the specified data source, much like verifying your access to the pantry before you start cooking. It's a streamlined approach designed to simplify the "Get Data" experience, especially for new report developers, ensuring a smooth and error-free data flow into the report.
What does this mean for you?
Since PBIDS files only allow you to have a single data source, its use case gets limited. A viable alternative for scenarios requiring connections to multiple data sources is to use the Power BI Template (.pbit) file instead. Unlike .pbids files, opening a .pbit file prompts the user to refresh the data source connection right away (recall the dialog box on the first screen), making it an ideal choice for organizations with access to specific, unified data sources.
Still, for completeness of knowledge, let's learn a little bit about the PBIDS file
How to create a Power BI data source file?
To illustrate the process of creating a .pbids file, let's take my report as an example again.
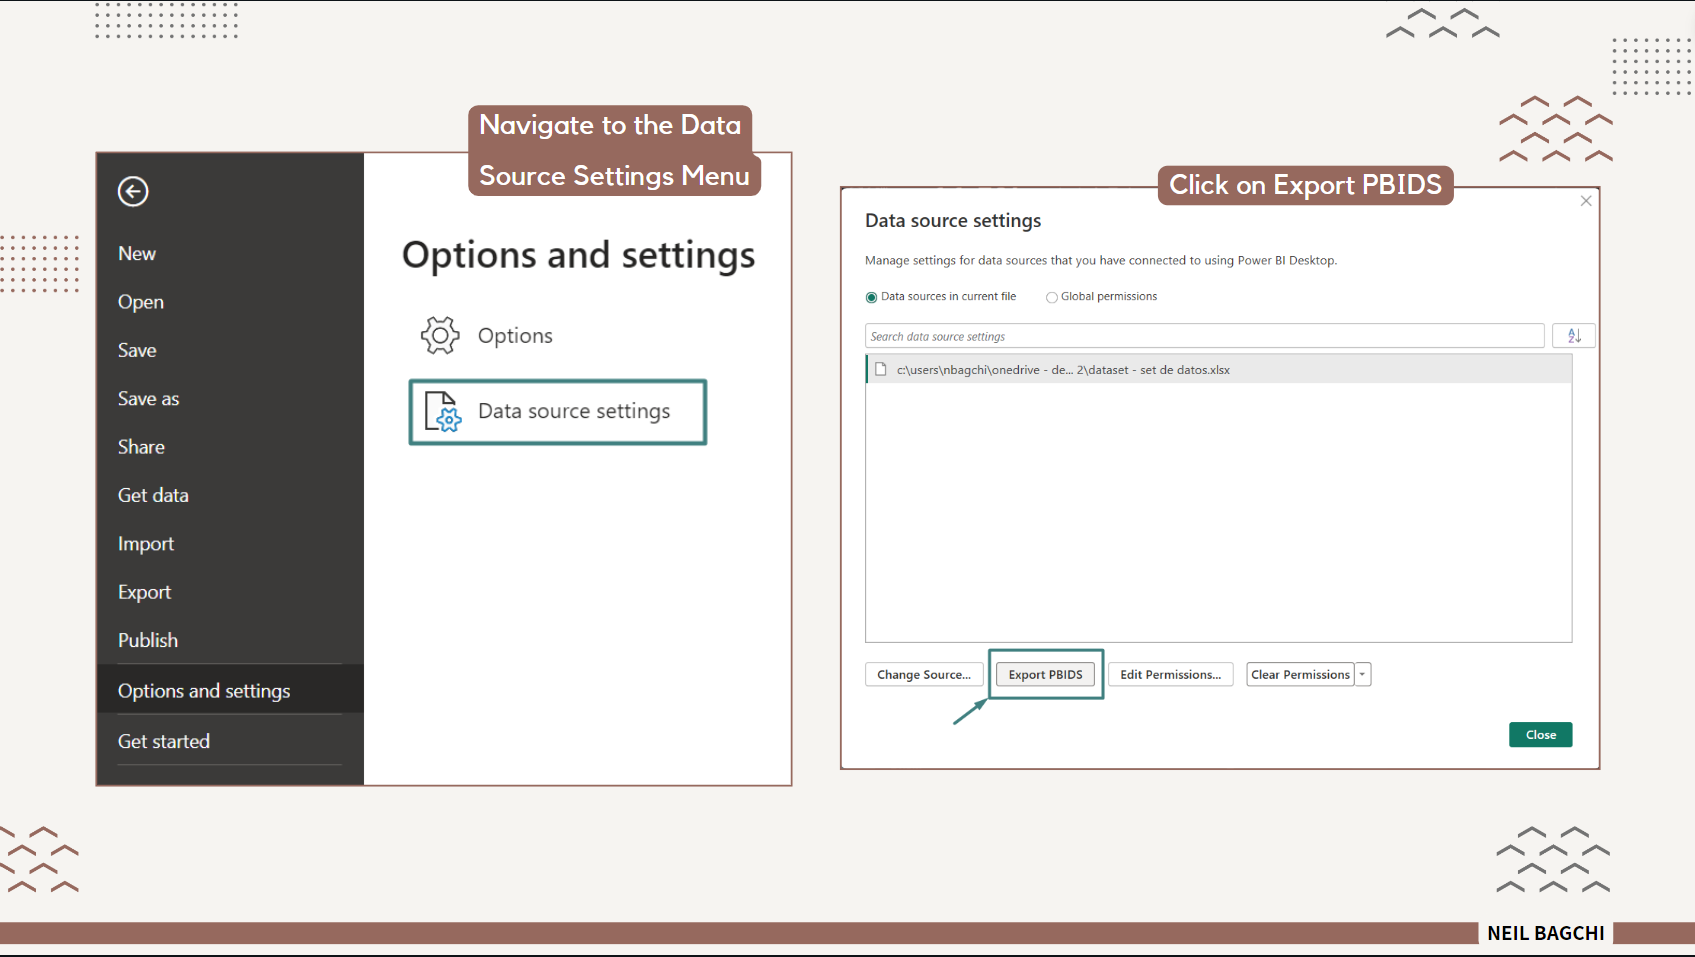
- Navigate to the 'File' menu and select 'Data source settings' from the 'Options and Settings' submenu.
- In the window that appears, you'll see a list of all data sources currently utilized in the report. For instance, in my case, I have a single data source, an Excel file
- Click on the 'Export PBIDS' option and save the file with a .pbids extension. Voila! You've successfully created your first Power BI data source file.
PBIDS file from an existing PBIXfileOpening your newly created .pbids file in Power BI Desktop will present the Navigator dialog box, prompting you to select the tables to load into the model. This step is contingent upon having access to the data source. If access is unavailable, a screen will prompt you to specify the correct path as shown below. Simply click on 'Edit' and update the path to establish a connection to the source.
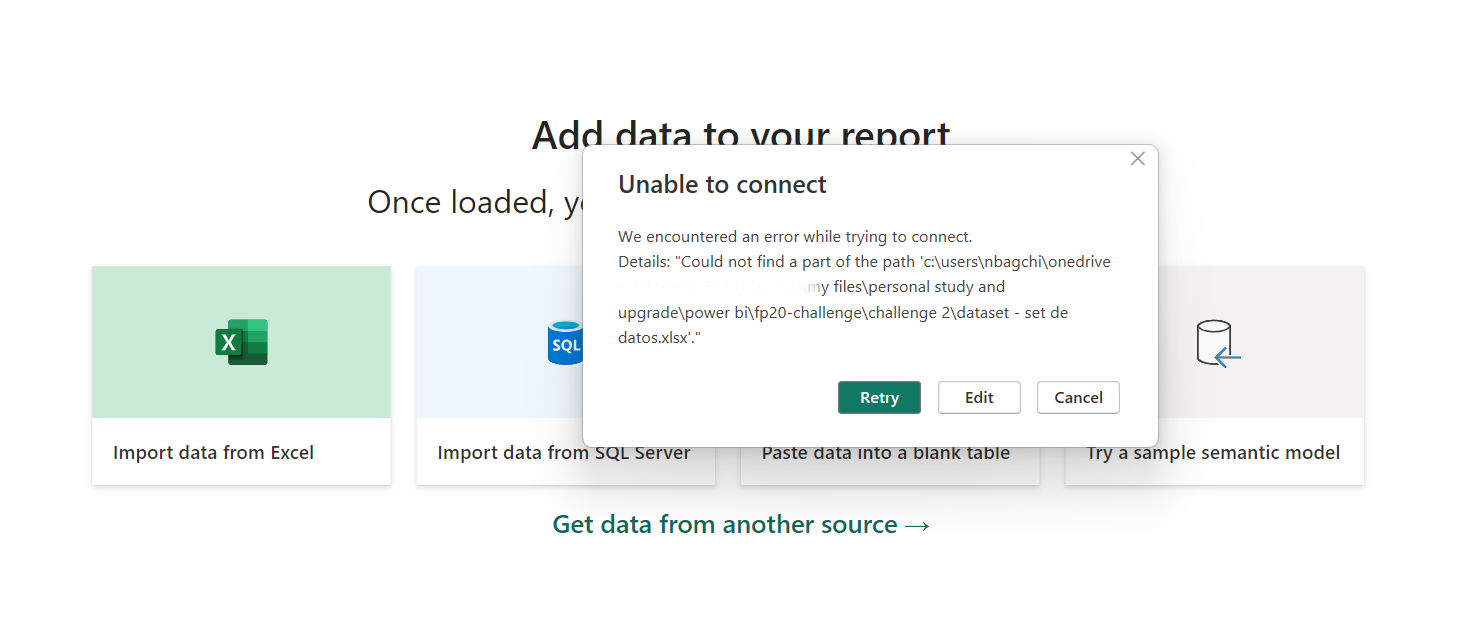
There you go. This is super simple, isn't it!!

The Signature Dish: .pbix Files
As ingredients combine on the stove, transforming under the chef's expert hands, the .pbix file represents the culmination of the data analyst's efforts. This file contains the data, reports, visualizations, and queries—the complete dish ready to be served.
Let's peel the layers to see what's under the hood !!
For the curious minds who relish the thought of understanding the intricacies of their tools, let's delve into what constitutes the core of PBIX and PBIT files. This exploration is akin to dissecting the layers of a complex dish to appreciate its components.
Interestingly, there's a straightforward method to peek inside these file types—transforming them from their native formats to something more universally accessible. By renaming the extension of both PBIX and PBIT files to .ZIP, we unlock the ability to explore their contents as if unzipping a bag of ingredients.

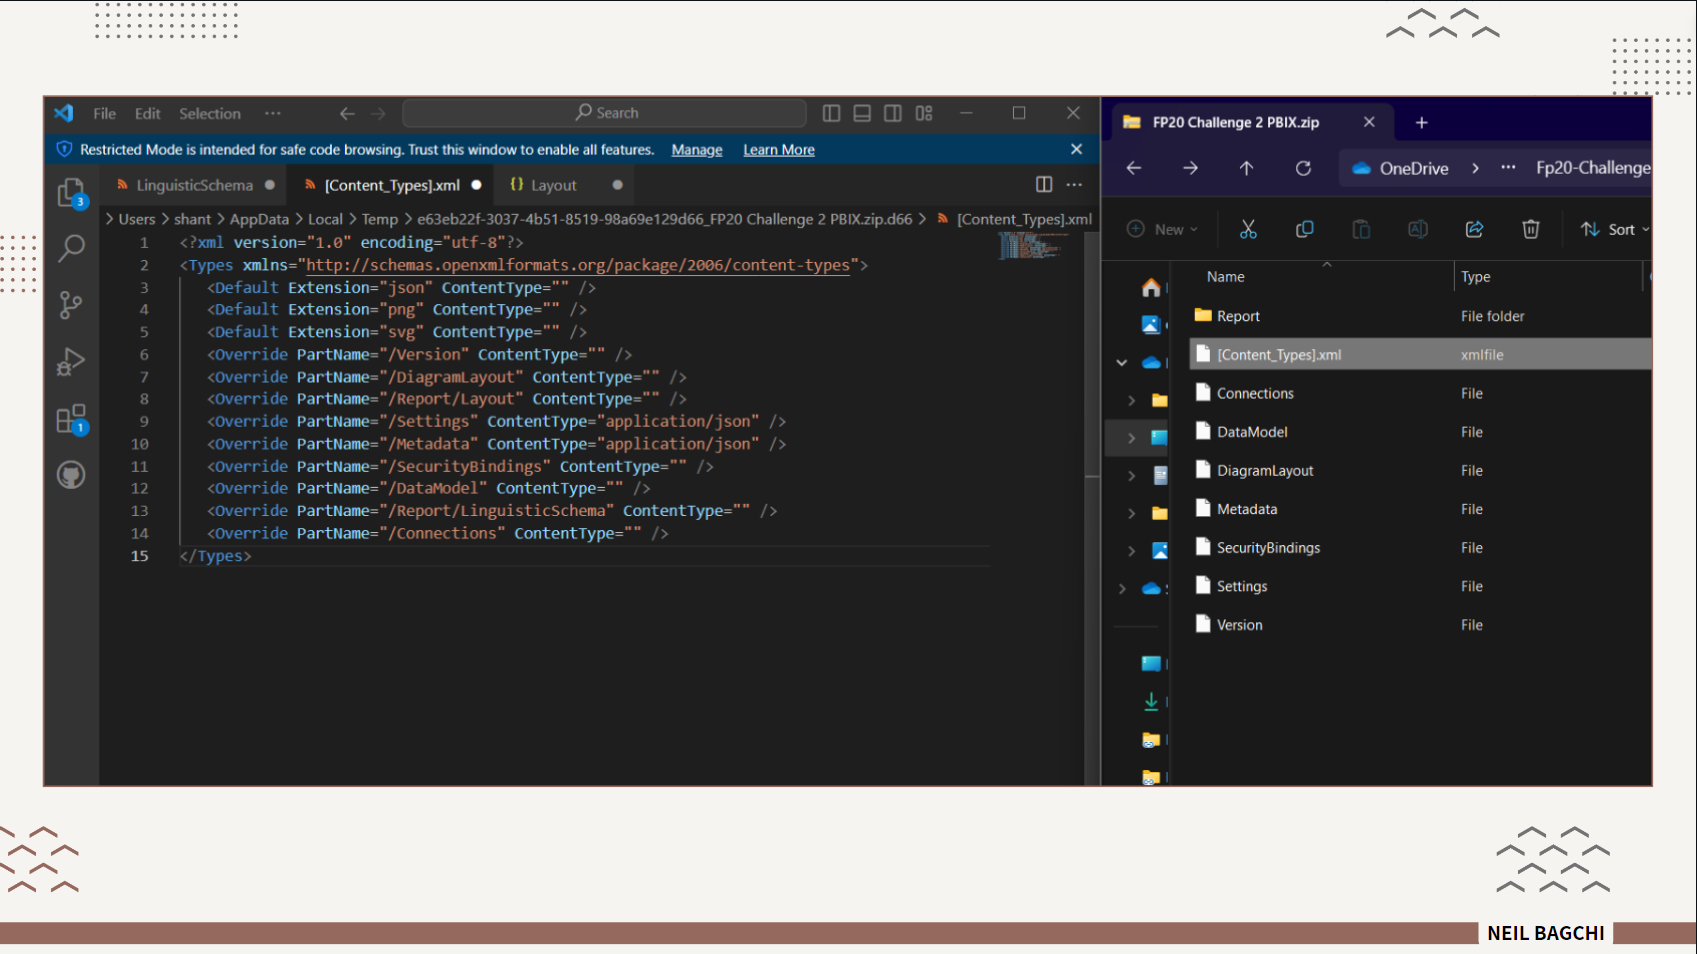
Do the same for the PBIX file as well. Now, if you open the ZIP files, you're presented with the various components neatly organized within. It's a revelation that transforms your understanding of how Power BI packages its contents. Cool trick, isn't it?
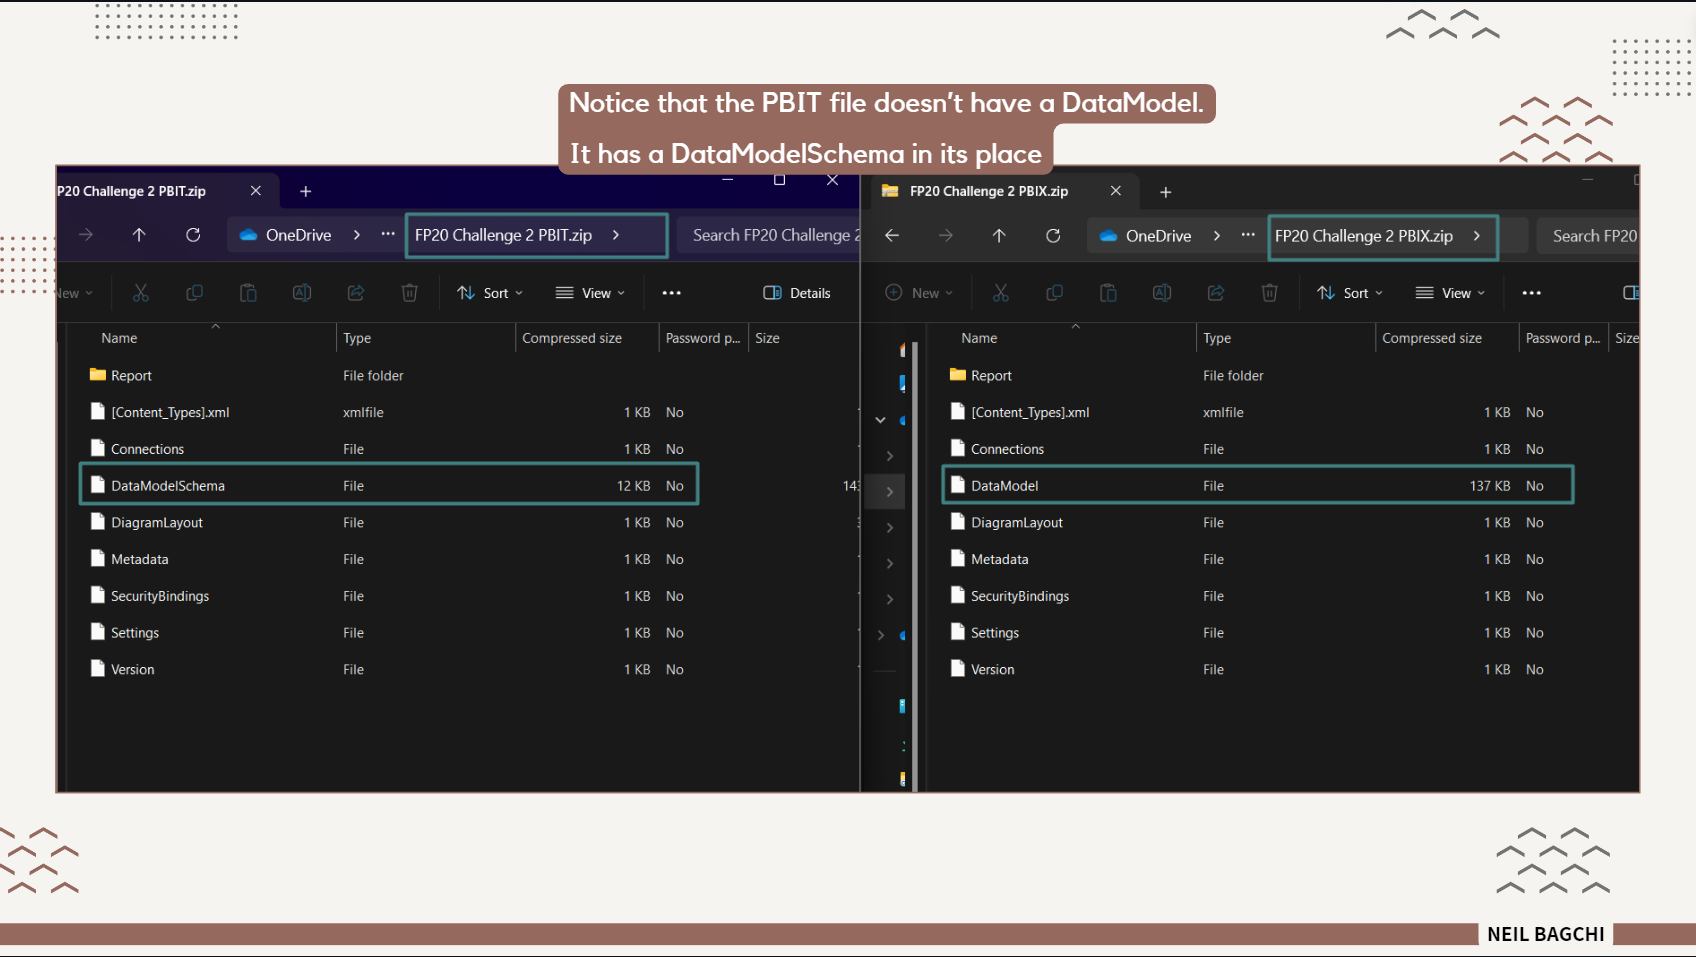
PBIT file Vs PBIX file on the rightYou can easily see that all the contents of the two files are the same except the DataModel file in PBIX file whereas you have the DataModelSchema file in the PBIT case. We will see what these contain in a bit.
Let's start with the Report Folder!
Layout File
Among the contents, the Layout file stands out. It holds the blueprint of your report layout, encompassing the sheets, the strategic placement of visuals, and all their related properties. This file is crucial as it dictates the aesthetic and functional arrangement of your report, similar to how a chef plans the presentation of their dish to enhance its appeal.
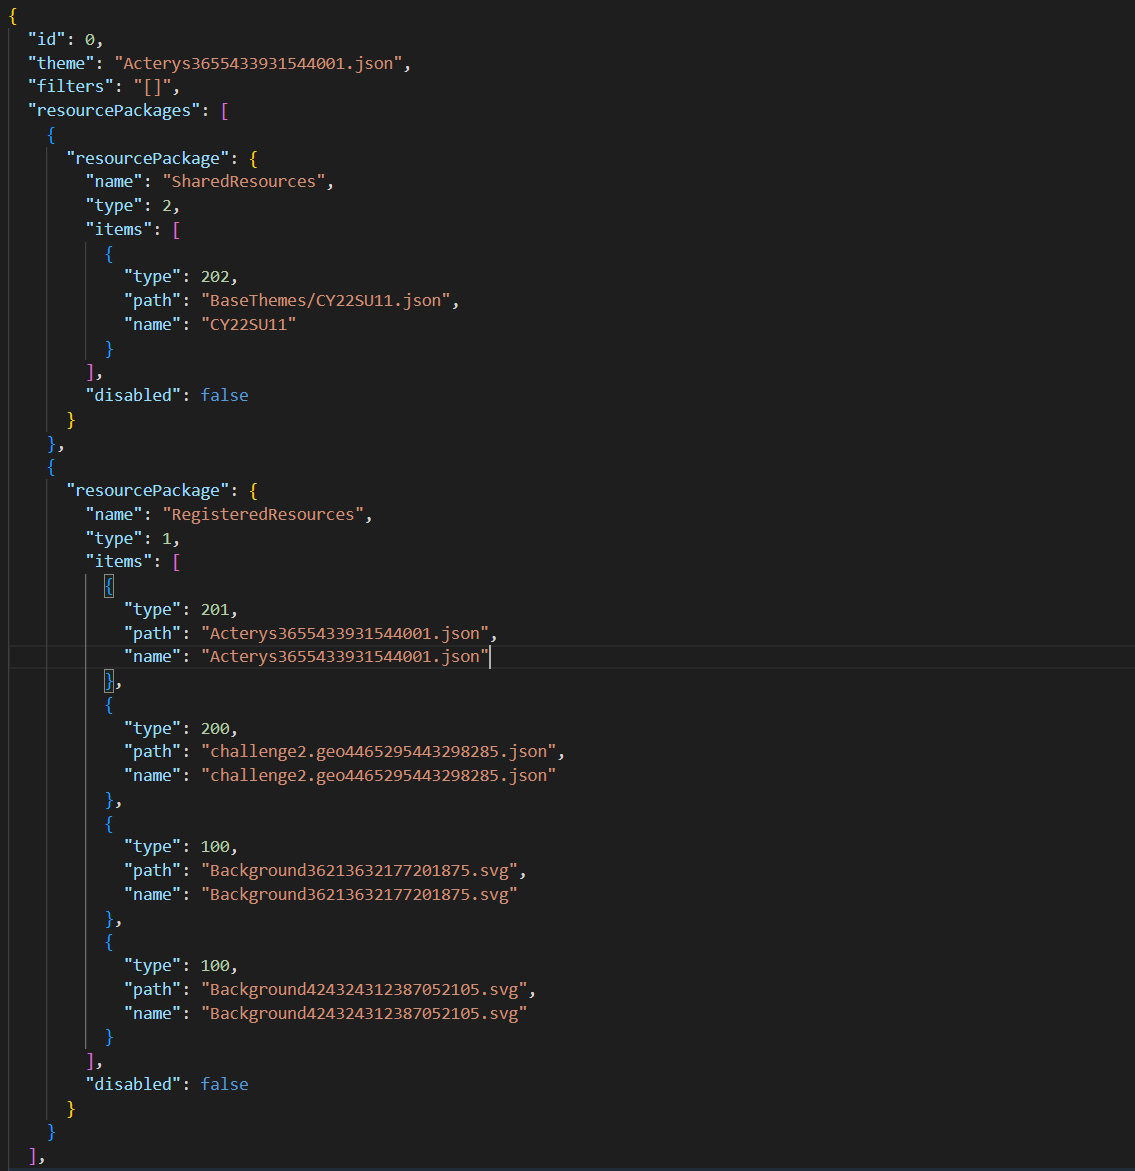
As you can see above, I used a custom theme which shows up here. The SVG files are the background images of the two report pages. You will find these in the same directory under 'RegisteredResources'. These are the custom ‘resources’ added to the PBIX, such as:
- Theme .json files
- Images imported into the report or canvas/wallpaper background)
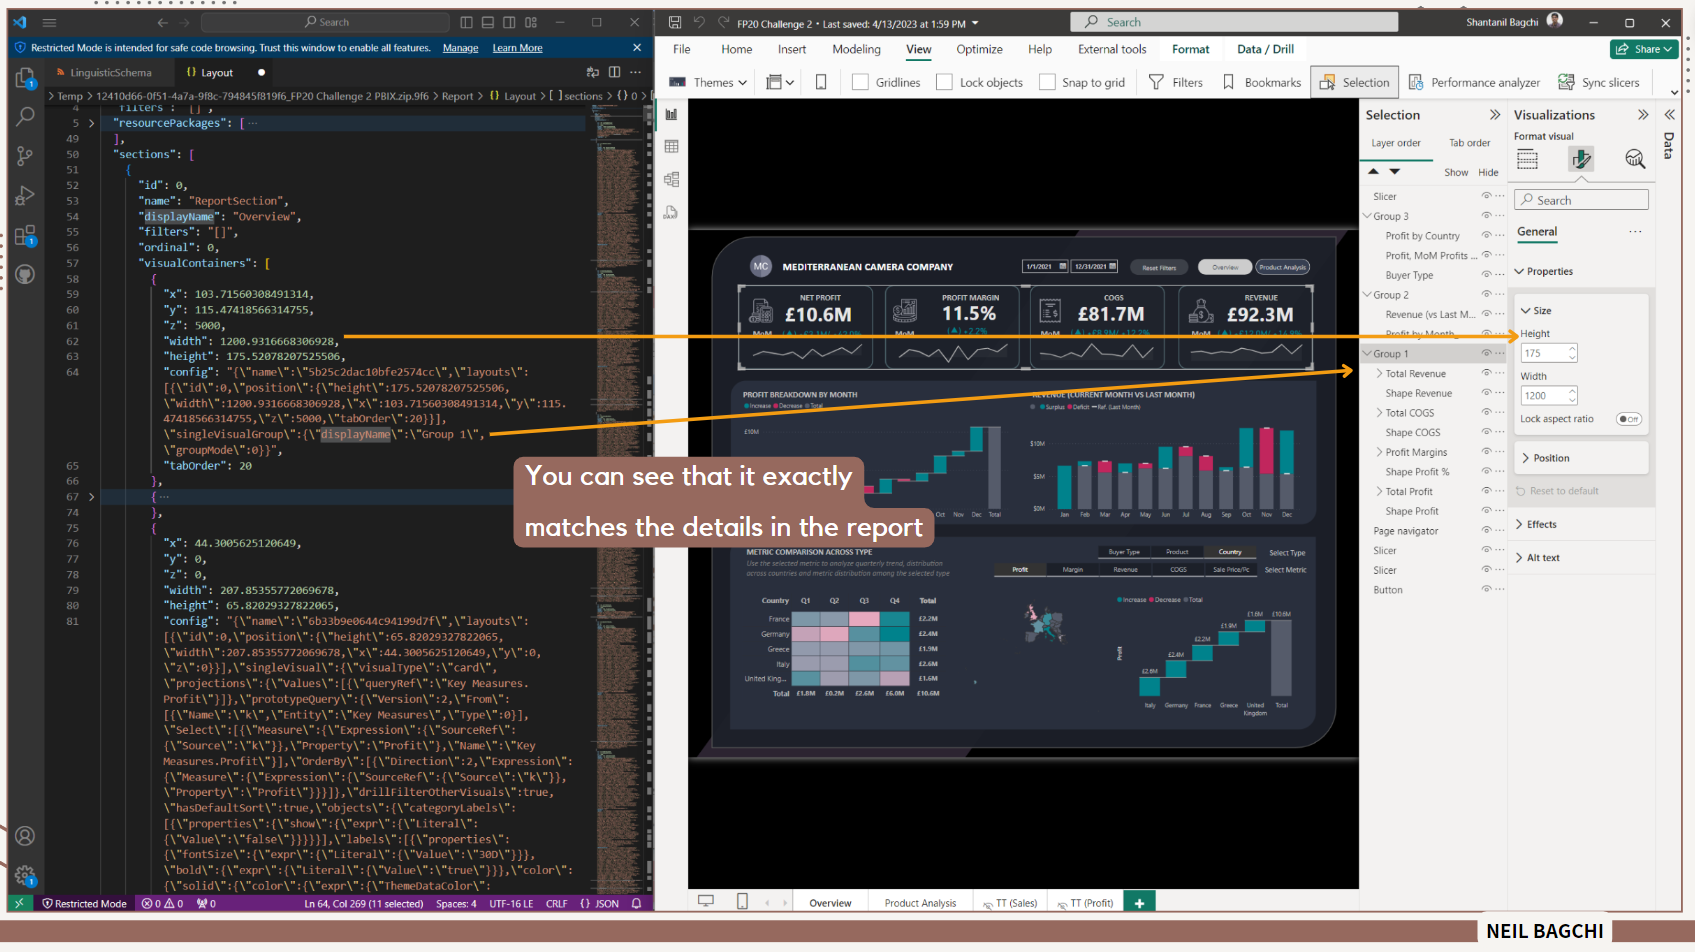
As you can see, the JSON file holds the position of the visuals as well as the formatting applied. There is a lot of information in the layout file, including Report-level and visual-level settings, Filters (Report, Page, Visual), fields that are used in the report and more.
Note: If you want to read what's in the "config" easily, replace \ with blanks and then use an online JSON formatter to reveal the contents. Following is a shortened version of the contents.
{
  "name": "6b33b9e0644c94199d7f",
  "layouts": [
    {
      "id": 0,
      "position": {
        "height": 65.82029327822065,
        "width": 207.85355772069678,
        "x": 44.3005625120649,
        "y": 0,
        "z": 0
      }
    }
  ],
  "singleVisual": {
    "visualType": "card",
    "projections": {
      "Values": [
        {
          "queryRef": "Key Measures.Profit"
        }
      ]
    },
    "prototypeQuery": {
      "Version": 2,
      "From": [
        {
          "Name": "k",
          "Entity": "Key Measures",
          "Type": 0
        }
      ],
      "Select": [
        {
          "Measure": {
            "Expression": {
              "SourceRef": {
                "Source": "k"
              }
            },
            "Property": "Profit"
          },
          "Name": "Key Measures.Profit"
        }
      ],
      "OrderBy": [
        {
          "Direction": 2,
          "Expression": {
            "Measure": {
              "Expression": {
                "SourceRef": {
                  "Source": "k"
                }
              },
              "Property": "Profit"
            }
          }
        }
      ]
    },
    "drillFilterOtherVisuals": true,
    "hasDefaultSort": true,
    "vcObjects": {
      "title": [
        {
          "properties": {
            "text": {
              "expr": {
                "Literal": {
                  "Value": "'Total Profits'"
                }
              }
            },
            "show": {
              "expr": {
                "Literal": {
                  "Value": "false"
                }
              }
            },
            "titleWrap": {
              "expr": {
                "Literal": {
                  "Value": "true"
                }
              }
            },
            "fontColor": {
              "solid": {
                "color": {
                  "expr": {
                    "Literal": {
                      "Value": "'#C8C8C8'"
                    }
                  }
                }
              }
            },
            "background": {
              "solid": {
                "color": {
                  "expr": {
                    "Literal": {
                      "Value": "'#495060'"
                    }
                  }
                }
              }
            },
            "alignment": {
              "expr": {
                "Literal": {
                  "Value": "'center'"
                }
              }
            },
            "fontSize": {
              "expr": {
                "Literal": {
                  "Value": "10D"
                }
              }
            },
            "fontFamily": {
              "expr": {
                "Literal": {
                  "Value": "'Segoe UI'"
                }
              }
            },
            "bold": {
              "expr": {
                "Literal": {
                  "Value": "true"
                }
              }
            }
          }...and so on..
        }
    }
  },
  "parentGroupName": "53a23ce040da26fc1767"
}
LinguisticSchema File
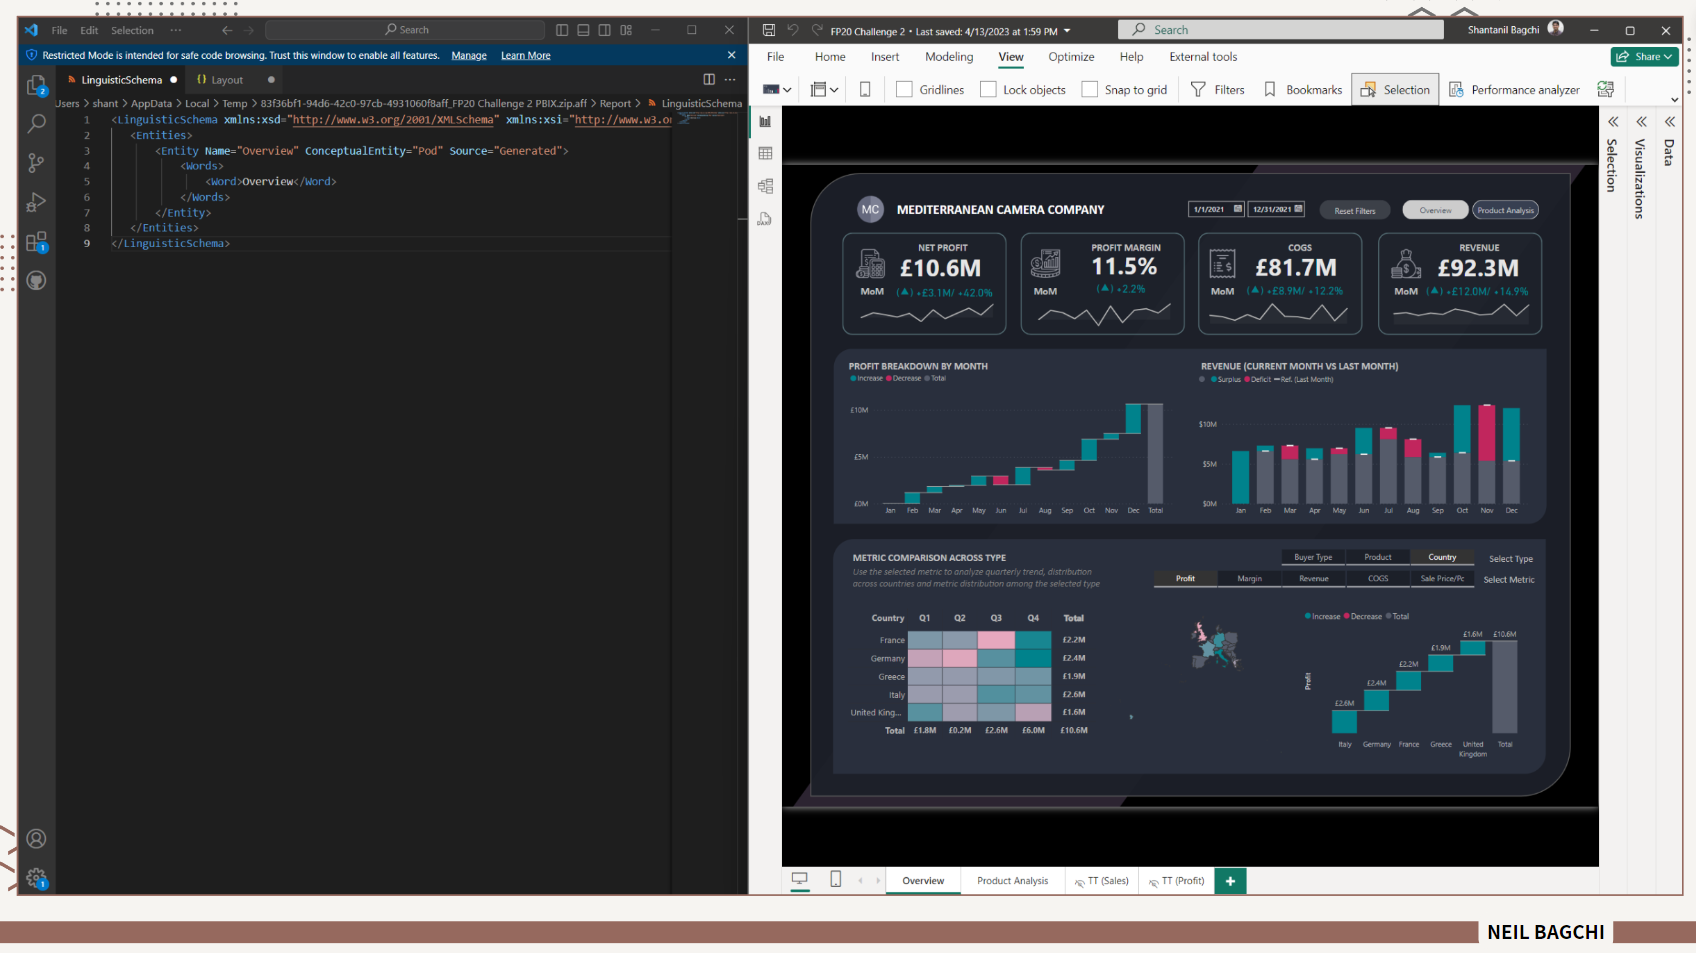
I believe the LignuisticSchema file essentially dictates the starting point of the report. It specifies the Sheet name or the page that should automatically open when the report is launched.
Note: While experimenting, I didn't see it getting created for each report.
[Content_Types].xml File
This XML file contains all the content within the PBIX file.
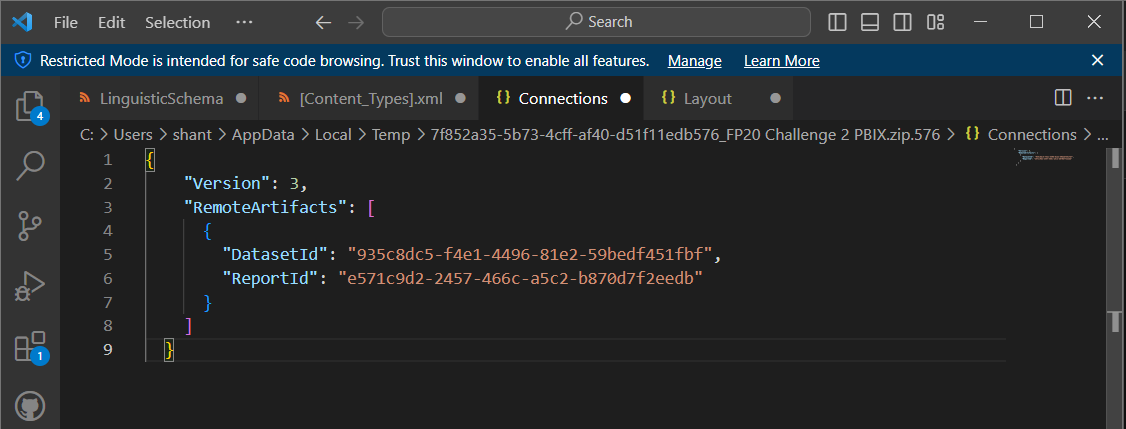
Connections File
A .json file that contains the connection string and parameters for your report.
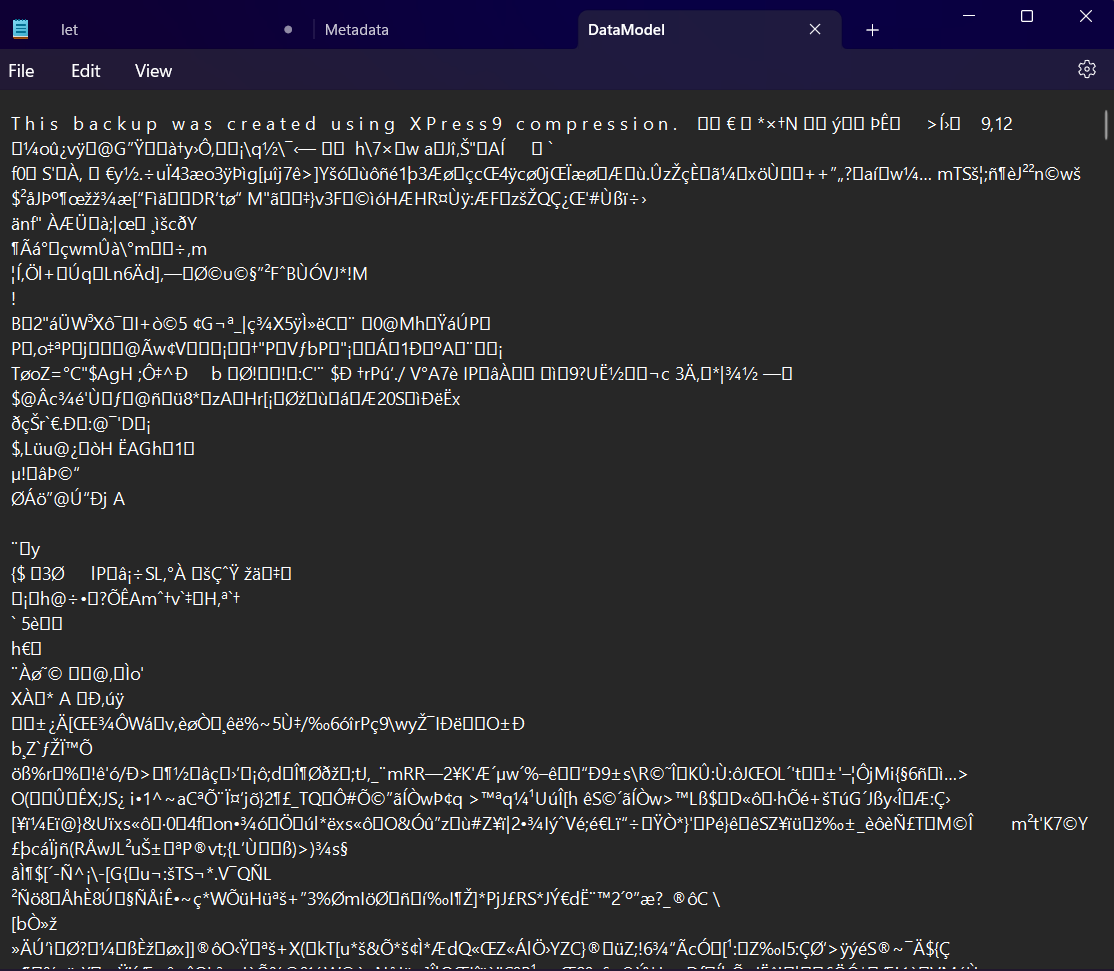
DataModel File
The DataModel file stands as a cornerstone, much like the core ingredient in a gourmet dish. This file stores all of your data in a highly compressed format.
As you can see below it has some detailed information about the compression type and then the stored data in non-human-readable format. I am guessing this is what's being read by the VertiPaq engine.
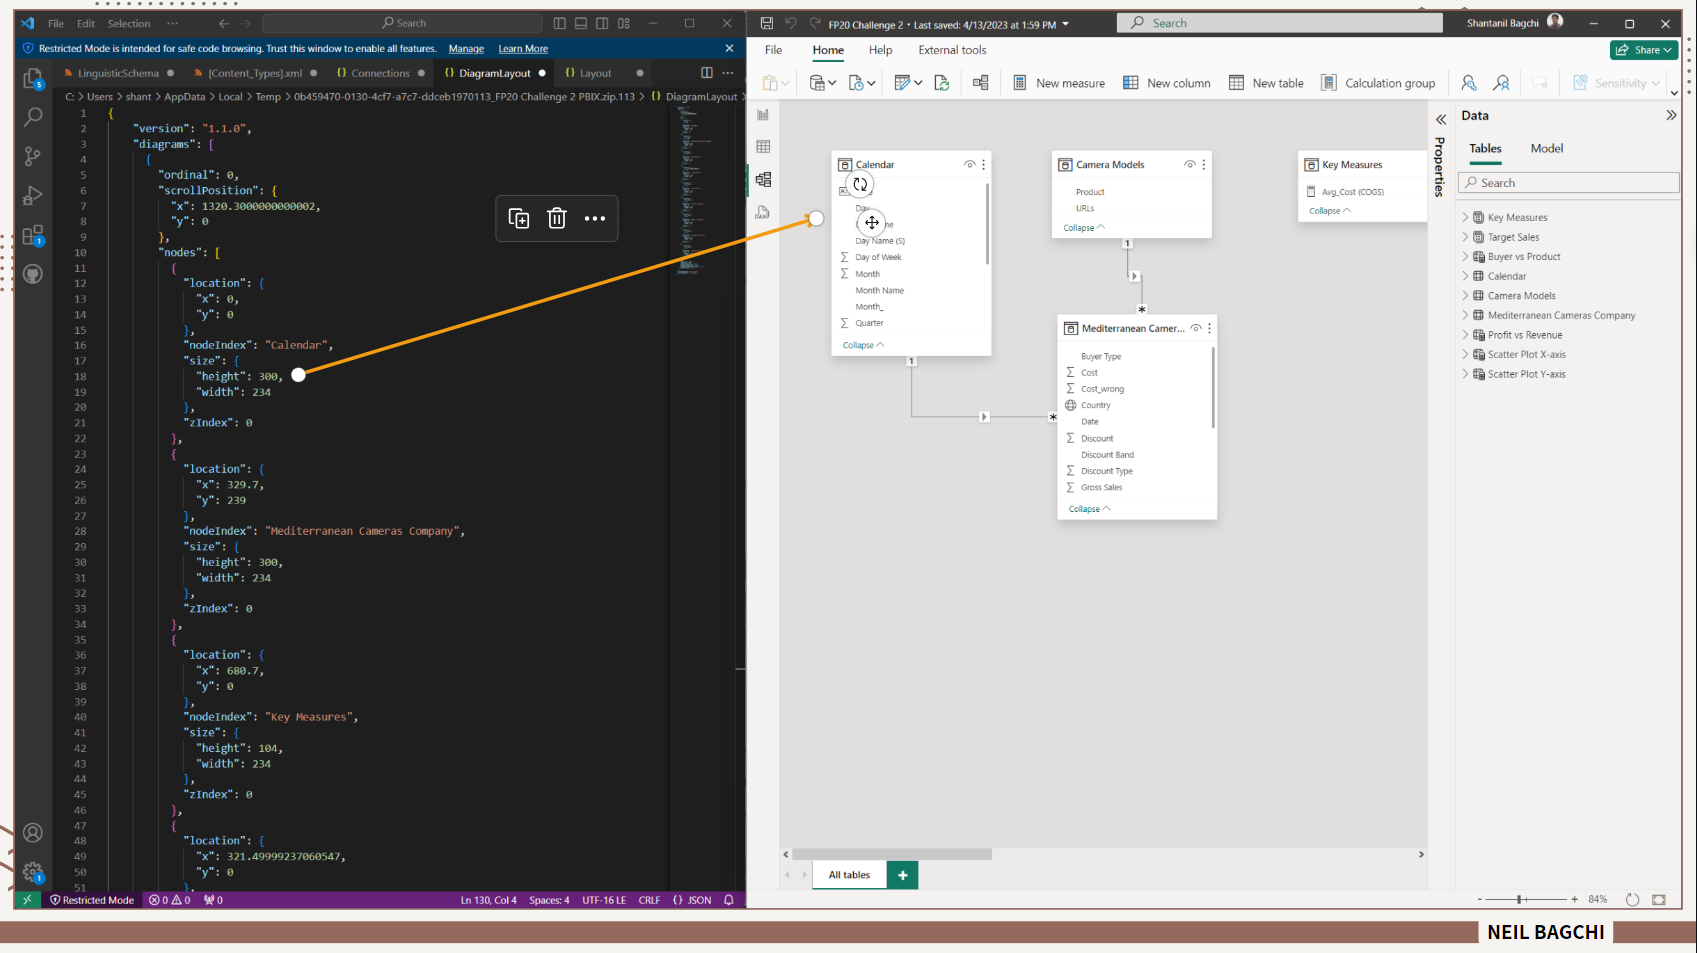
DiagramLayout File
The DiagramLayout file appears to store the ModelView page information in JSON format. It stores the location of the specific tables on the page.
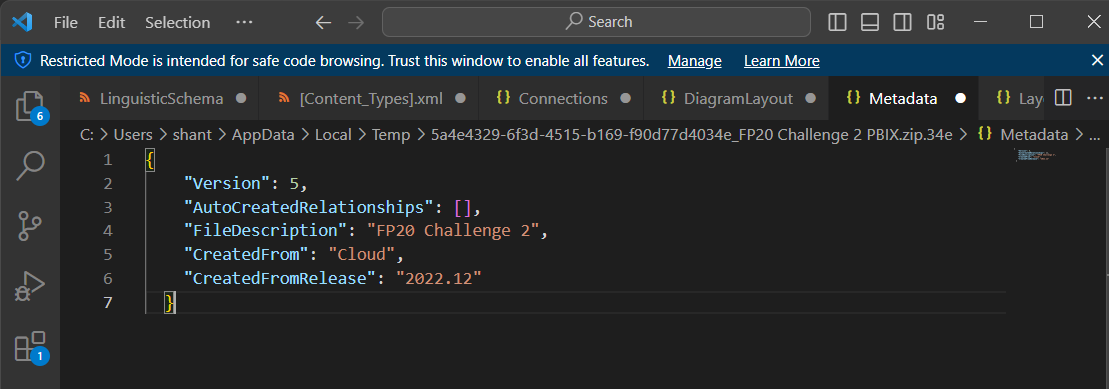
Metadata File
It would appear that the Metadata file contains a description of the report such as whether the report was created in Power BI Desktop or Service and then downloaded to the desktop. In my case, you can see that I had downloaded it from my Power BI Service account.
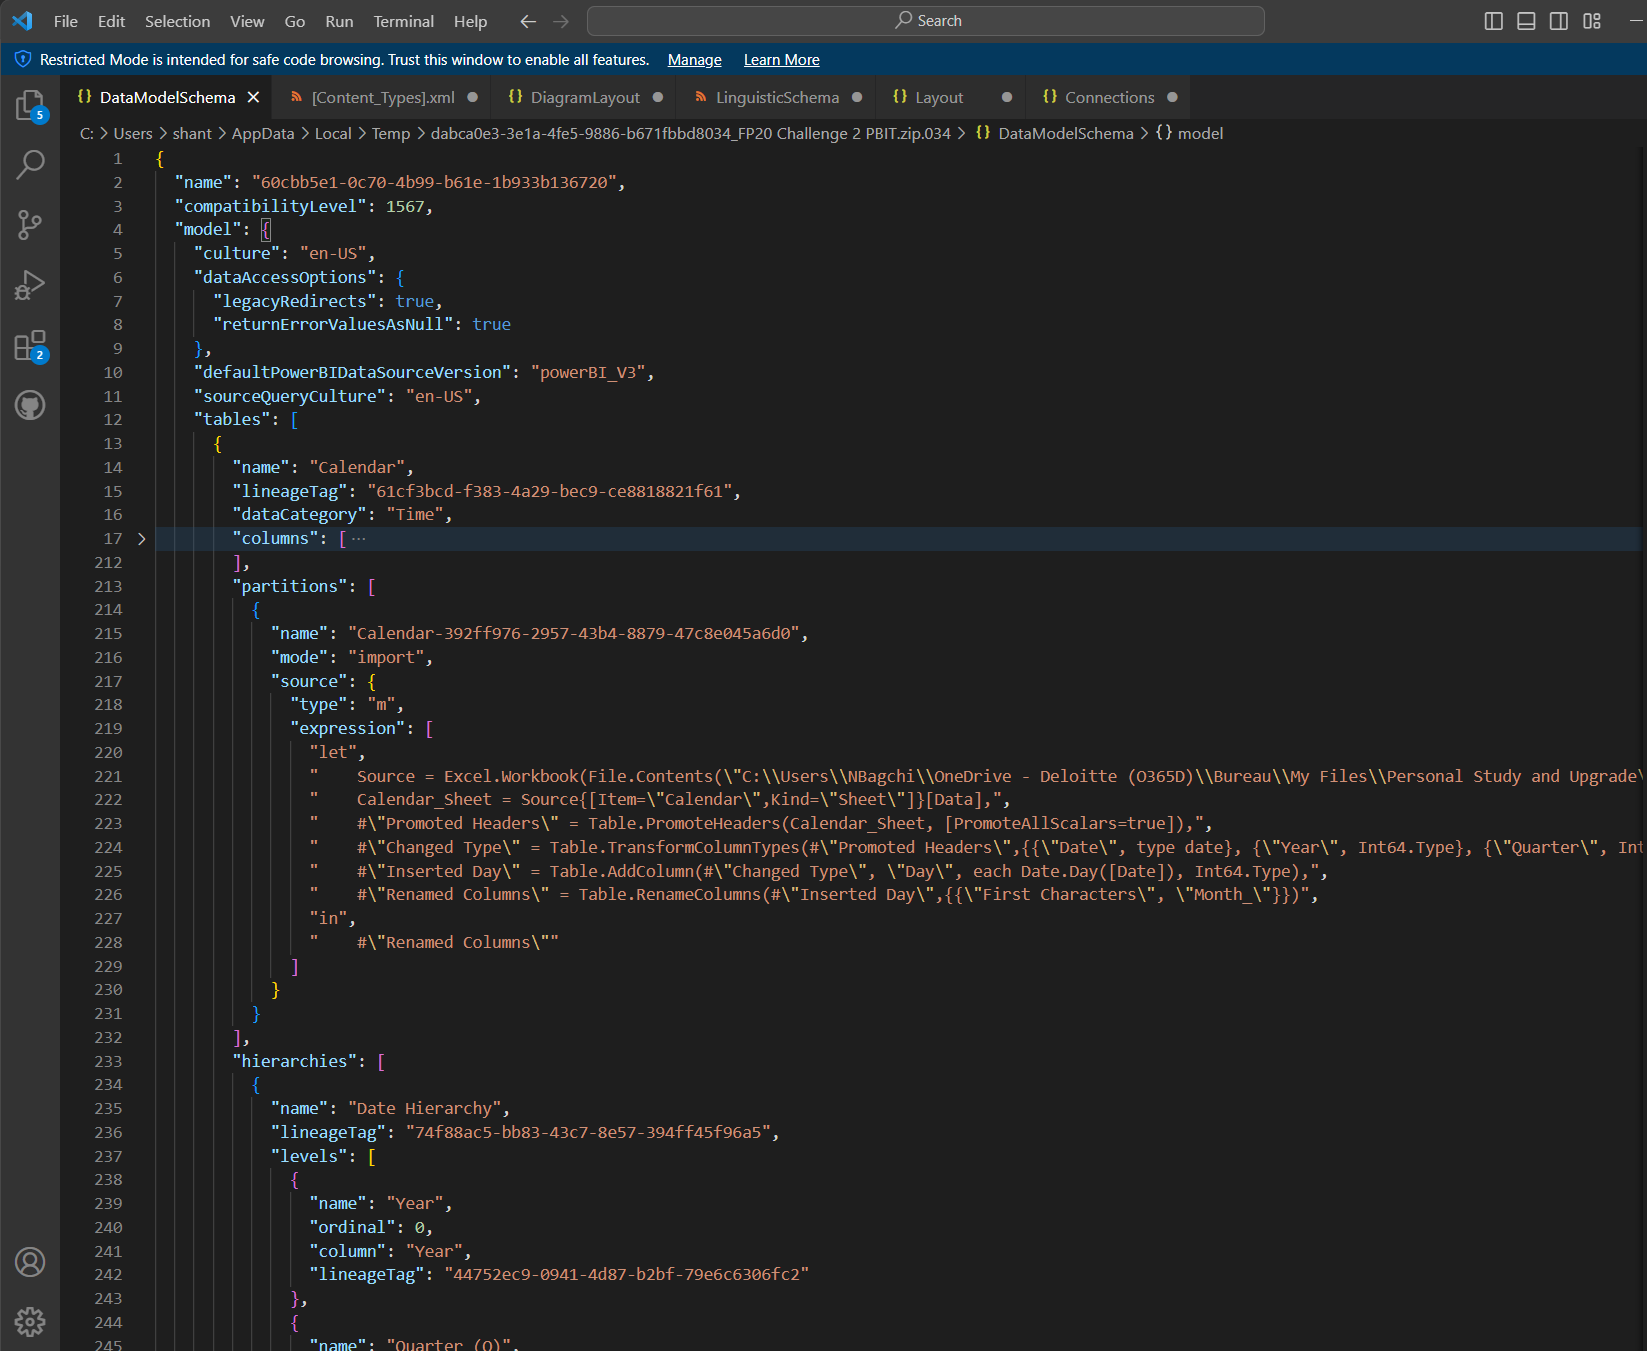
DataModelSchema File
Finally, this is the file that is different in the PBIT zip file compared to the traditional PBIX file. As you can see, it contains all the details about the Power Query M-code, the hierarchies and more but not the data itself. This is what you utilize to re-connect with the data source when running a PBIT file.
Tip if you screw up!! 😅
I recommend trying this new hack on a duplicate file but still, if you have modified your original file and want to go back to the PBIX or PBIT file, simply delete the SecurityBindings file and rename the zip file with the correct extension like <report_name>.pbix in place of <report_name>.zip.
Here are the template files and the actual dataset. Practice and see if you can recreate the PBIX file using these two files !!
If you need help, feel free to send me an email or contact me on LinkedIn. 😊
New kid on the block
Power BI Desktop introduced a new way to author, collaborate, and save your work called Power BI Project (PBIP) files. The report and dataset definitions are saved as individual plain text files to assist in easier source control and CI/CD. We will keep this for a future post since this alone will require an in-depth post. For now, if you want to learn more, check out the Microsoft official site.
Conclusion
This blog post provided a detailed introduction to automating and standardising organizational reports through reusable assets. Whether you're a data analyst, business intelligence professional, or just looking to level up, mastering the various kinds of options available is a journey worth embarking on.
For more detailed insights and guidance, it's beneficial to explore various resources and examples provided by experts in the field. Check out the following websites that help illustrate more practical applications.
Dive Deeper
